Key findings
- 2026 H1 saw the highest BRI engagement for any first six months since 2013, with USD49.8 billion in investment and USD76.5 of construction contracts.
- China’s energy related engagement in 2026 H1 reached record levels with about USD36.3 billion – almost double the energy engagement in any first half year since 2013 except 2025.
- 56% of China’s energy engagement was green – a new record both in absolute and in relative terms
- More than USD20 billion in H1 2026, same level as green energy engagement in all 2025;
- More than 20 GW of green electricity projects confirmed through investment and construction – more than in all of 2025.
- A Chinese company agreed to build a new 660 MW coal fired power plant in Zambia – approvals are pending.
- Metals and mining sector reached a record high of USD 21.8 billion in 2026 H1 alone, higher than any full year since 2013 except 2025 – mostly in processing not mining.
- Focus areas were steel production (Egypt) and aluminum (Kazakhstan), highly relevant for e.g., automotive manufacturing and transmission lines.
- The technology and manufacturing sector reached record levels growing by about 11% (technology) and 81% (manufacturing) compared to 2025 H1 to USD17 billion and USD6.5 billion, respectively.
- The transportation sector grew for the first time since 2020 to USD18.2 billion – all through construction contracts.
- Africa – again – topped the regional rank of BRI engagement, almost tripling Chinese BRI investment compared to H1 2025 to USD33.5 billion – more than ever.
- Middle East tops the list of construction engagement with USD 36.5 billion – record levels for any H1 since 2013.
- No engagement in Pakistan or Russia recorded in H1 2026.
- The private sector expanded its share of total engagement (USD) from 13% in 2020 to 48% in 2026 H1 (as compared to state-owned companies).
- China’s global footprint in overseas investment remains small compared to its GDP (0.8%) – significantly smaller than Germany (1.7%), The Netherlands (4.0%), Japan (4.2%), or UAE (10.1%).
- For the rest of 2026, I see continued opportunities for Chinese engagement in BRI countries with a continued focus on energy, mining and new technologies.
- Both global trade frictions and fossil fuel price volatility can be an opportunity for Chinese BRI engagement such as green sectors and manufacturing localization.
Overview – record first half in total Belt and Road Initiative (BRI) engagement, but drop in investment
Preliminary data on Chinese engagement in the 150 countries of the Belt and Road Initiative1 through investments and construction contracts show combined record for any first half year:
- USD 76.5 billion (+ USD 12.2 billion compared to 2025 H1) in construction contracts
- USD 49.8 billion (- USD 6.2 billion compared to 2025 H1) in investment[1]
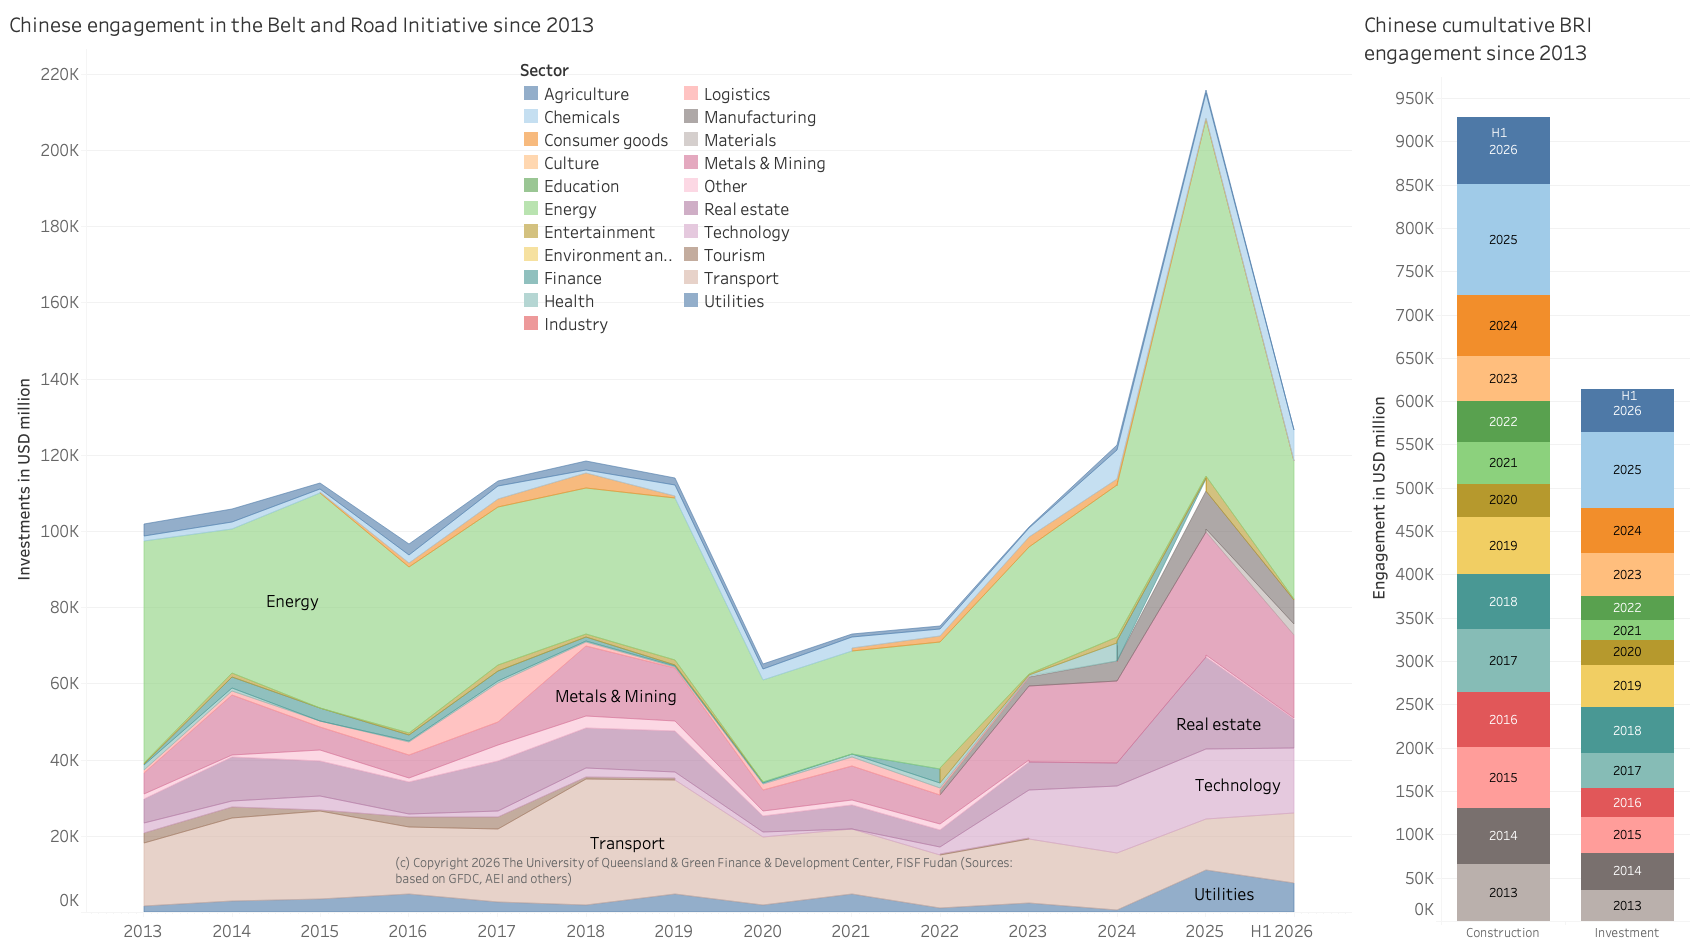
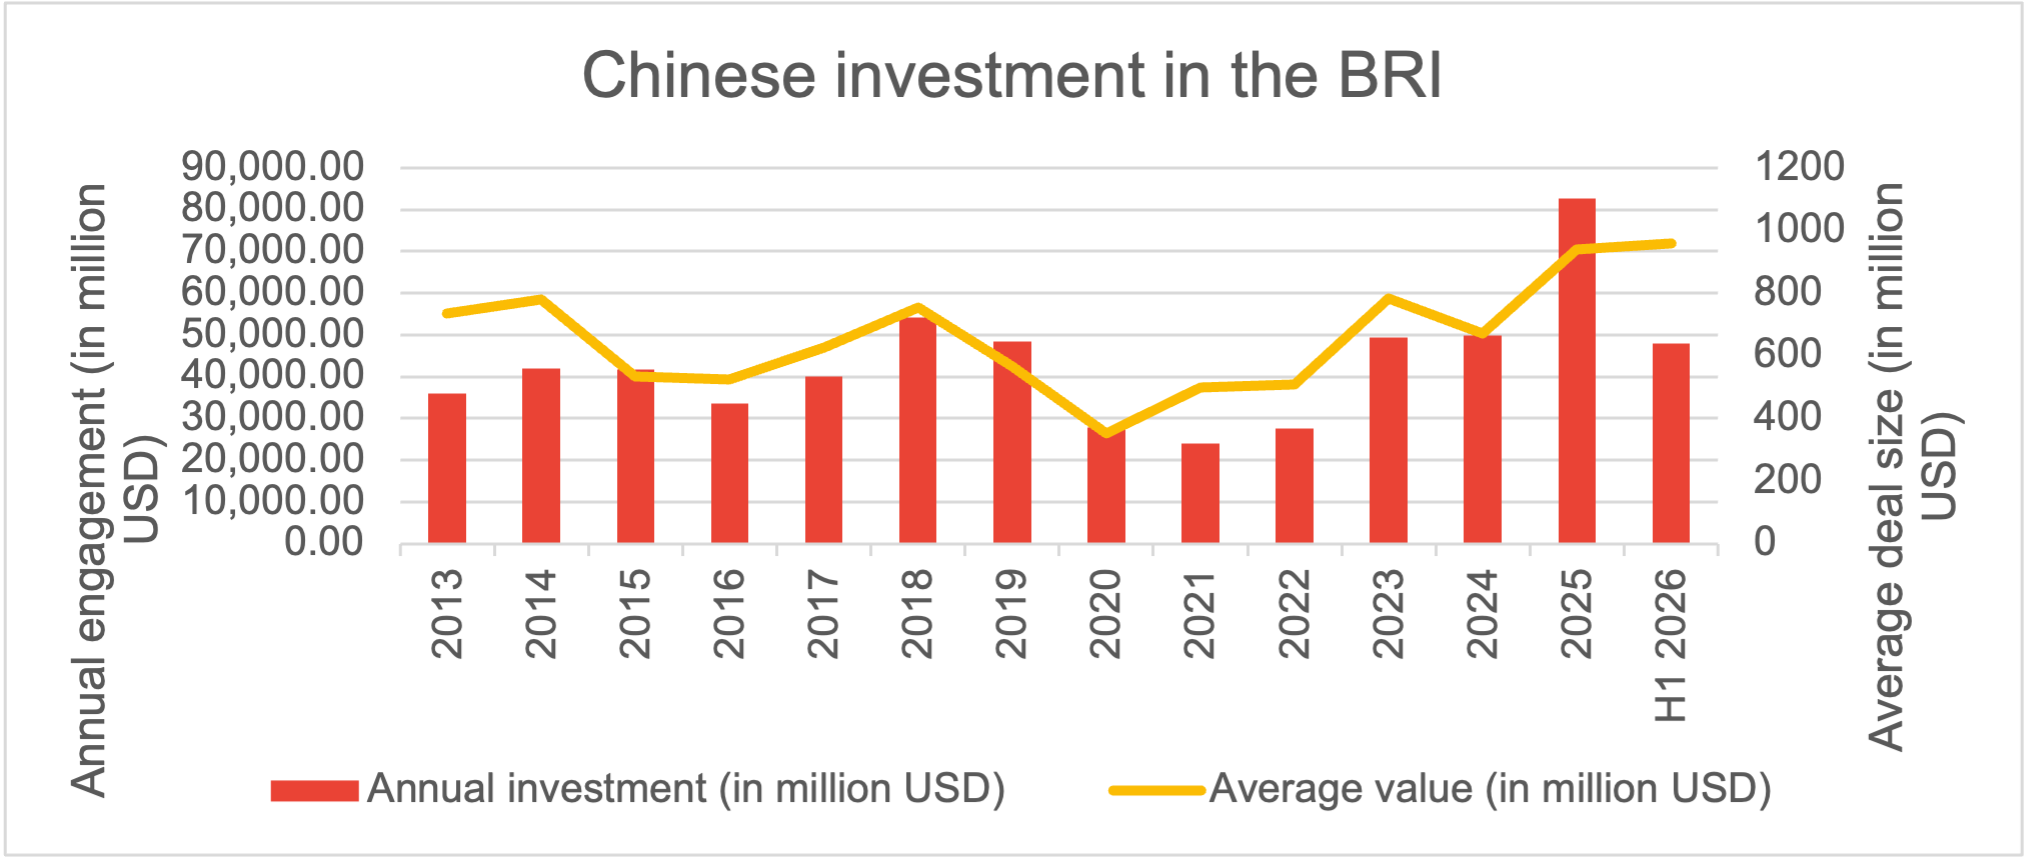
This equals to a total engagement of USD 126.4 billion through construction contracts and investments (see Figure 1) in about 186 deals in 2026 H1 (+2 in deal numbers compared to 2025 H1).
Cumulatively, Chinese BRI engagement has reached USD 1.539 trillion since 2013 of which USD 926 billion in construction and USD 614 billion in investments.
| About the data and methodology: In June 2026, the Ministry of Commerce (MOFCOM) released new BRI engagement statistics covering the period of January to May 2026. According to these data, Chinese enterprises invested about USD 14.66 billion in non-financial direct investments in Belt and Road partner – a decrease of 5.7%). At the same time, the value of newly signed project contracts by Chinese enterprises in Belt and Road partner countries was USD 89.66 billion (an increase of 5.2%). While the MOFCOM data are relevant and confirm the trends, the granularity and definitions of BRI engagements are not transparent, including what counts as BRI countries. For this report, BRI engagements are defined as those Chinese construction and investment deals in countries that we have identified as having an active Memorandum of Understanding (MoU) with China to cooperate under the BRI at the time of the report. To stay consistent with data over time and avoid an inflation/deflation of the value of BRI engagement across time simply by adding/subtracting countries that enter or exit the BRI in each given year, the analysis counts Chinese engagement in current BRI members, no matter when they signed the MoU (thus, if the Syrian Republic signed a BRI MoU in 2022, the analysis counts Chinese engagement in Syria since the initiation of the BRI in 2013 as BRI engagement in Syria). A similar approach is used for countries that exited the BRI (i.e., if Italy exited the BRI in 2023, the analysis does not count any Chinese engagement in Italy to the BRI engagement for any year). The definition of BRI countries currently includes 150 countries that had signed a cooperation agreement with China to work under the framework of the Belt and Road Initiative (BRI) by December 2025. Our data since 2024 are collected based on a rigorous independent collection process: we include projects with validated credible sources or two independent sources. We include projects with a signed contract for implementation or clear announcements of investments (e.g., stock market announcements). We consistently aim to include projects worth about USD20 million. The data until 2023 was reliant on the China Global Investment Tracker (CGIT), published by the American Enterprise Institute, which only include deals larger than USD 100 million. We have significantly expanded the original CGIT data based on our research also for the years until 2023. As with most data, they tend to be imperfect and need regular updating. |
Share of construction in China’s BRI increases driven by high valued construction contracts
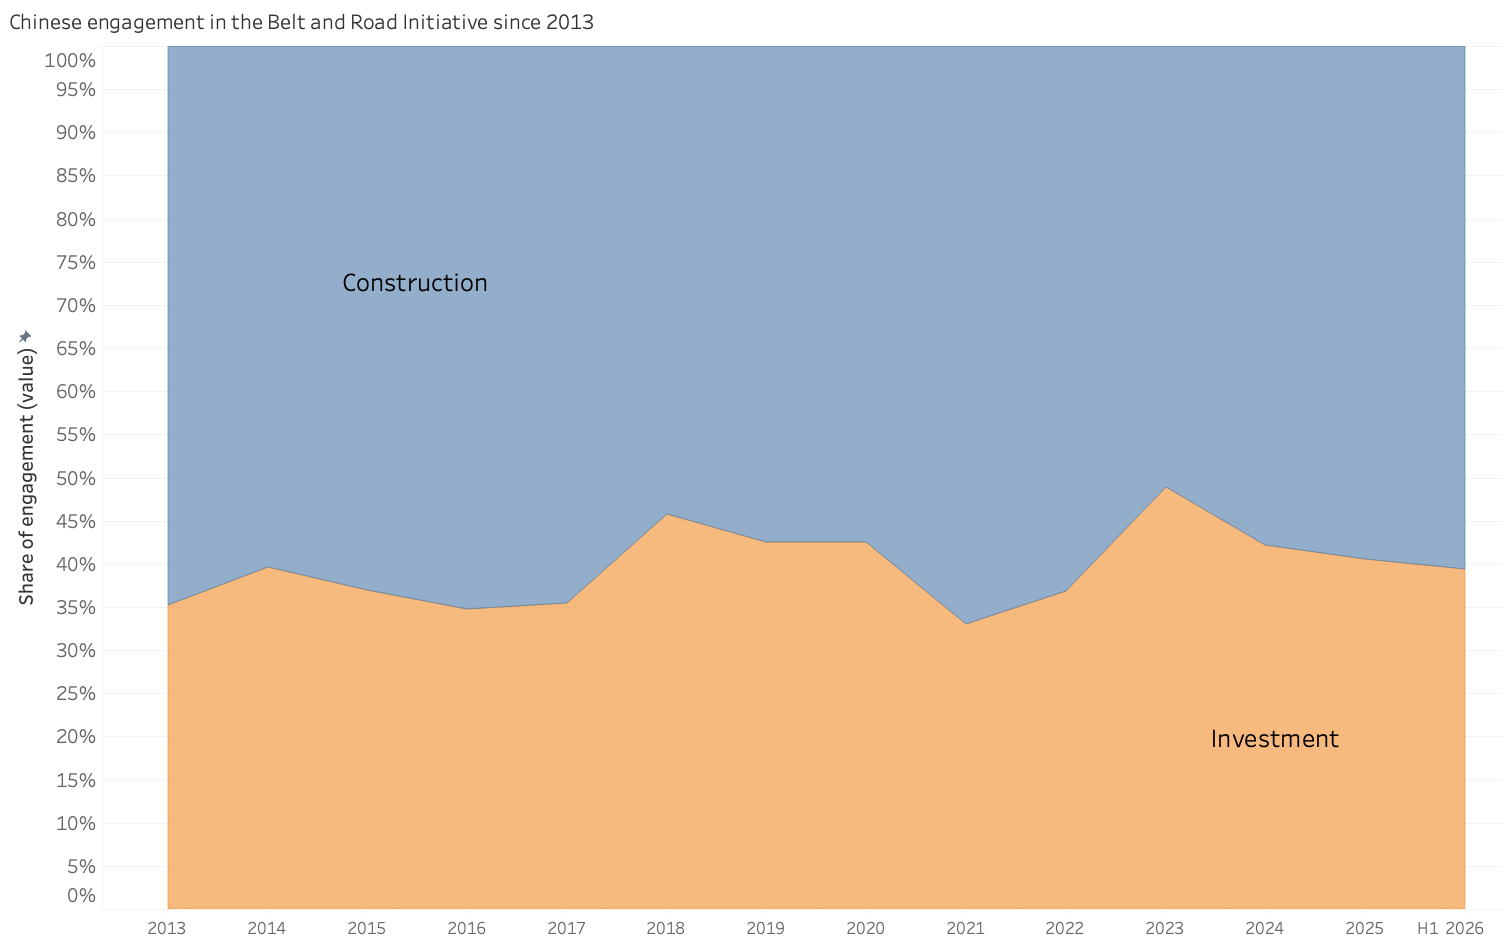
The share of Chinese engagement in the BRI through construction reached about 60.6% and increased compared to 2025 driven by high construction volume increases. This compares to about a share of 39.4% for investment of Chinese BRI engagement (see Figure 2).
| Good to know: Construction contracts used to be financed through loans provided by Chinese policy banks often utilizing host country guarantees. Recently, many construction projects were funded through syndicated loans with international partners, including multilateral development partners. One project example is a multitude of BESS projects built by Chinese contractors in Egypt, which are backed by up to USD223.5 million of senior debt financing from the European Bank for Reconstruction and Development (EBRD). |
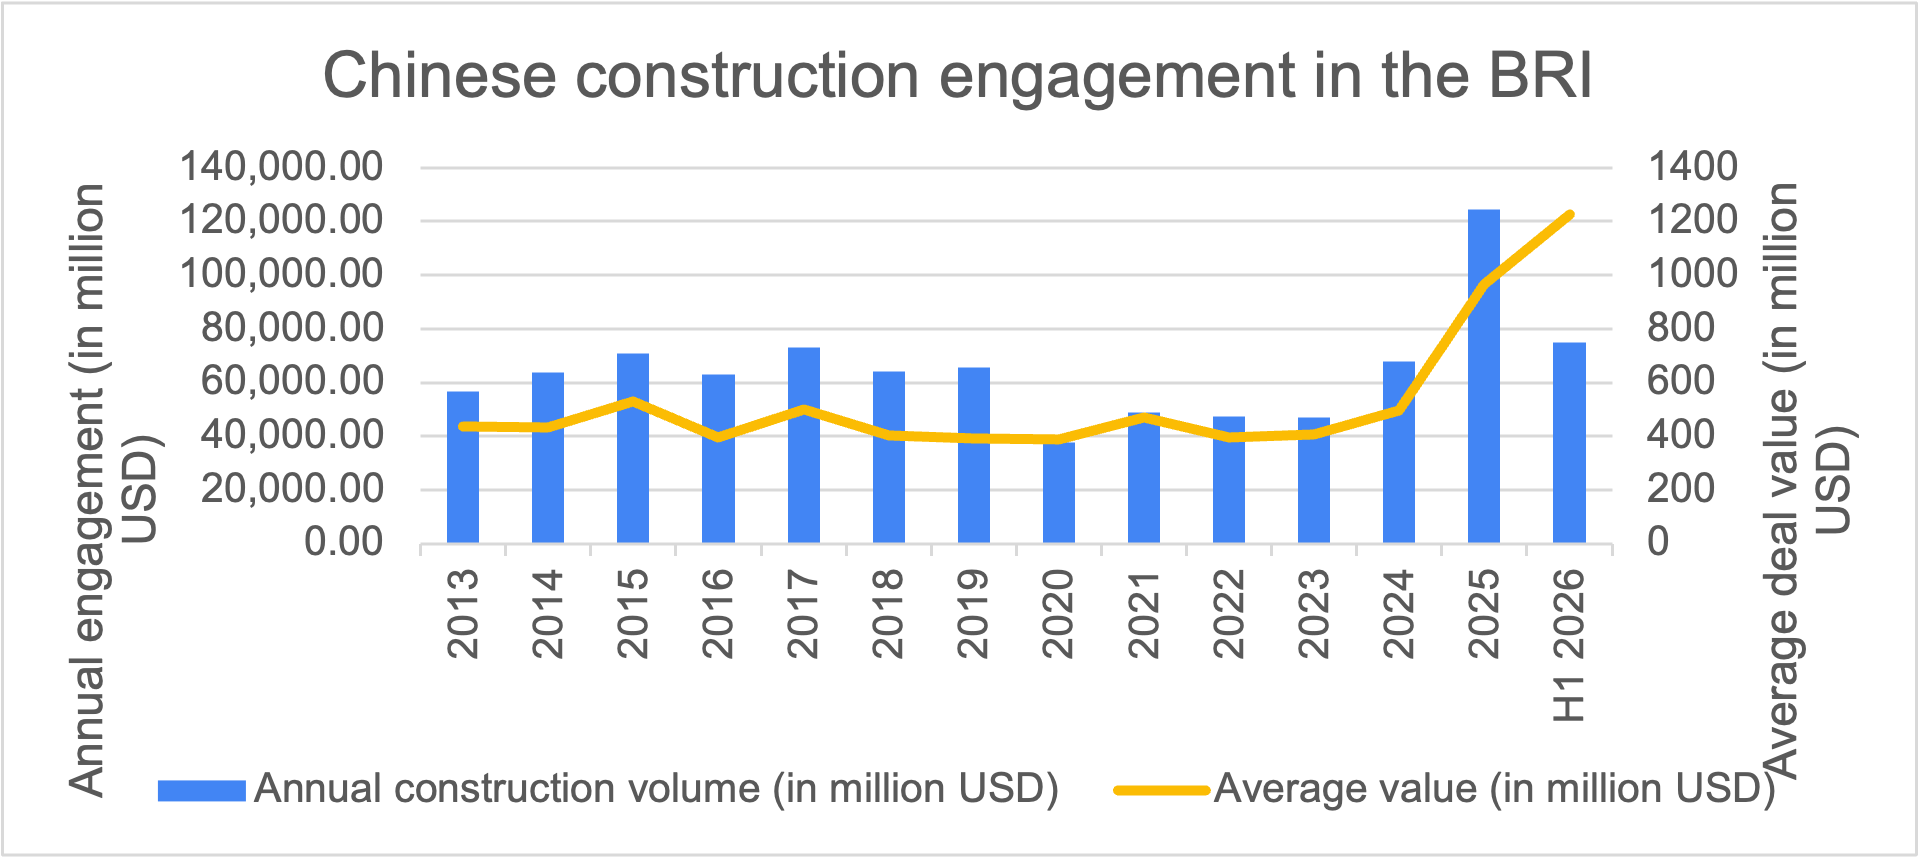
The average deal size for investments with a value larger than USD 100 million grew to record levels of USD 958 million in 2026 H1 (from USD 672 million in 2024)[2]. The value is about three times higher than in 2020 (during the first year of COVID).
For construction projects, the average deal size in 2026 H1 increased to USD 1.23 billion, up from USD 496 million in 2025 (see Figure 3).
Both developments are driven by 32 large projects with a volume of more than USD 1 billion (up from 29 such projects in the first half of 2025), such as a USD 8 billion rail construction project in UAE, or a USD 10 billion investment project in Egypt’s steel sector.
Similar to last year, this leads to the conclusion that the “small yet beautiful projects” (小而美)propagated through official channels during COVID should be seen as bygone.
Regional analysis of Chinese BRI engagement
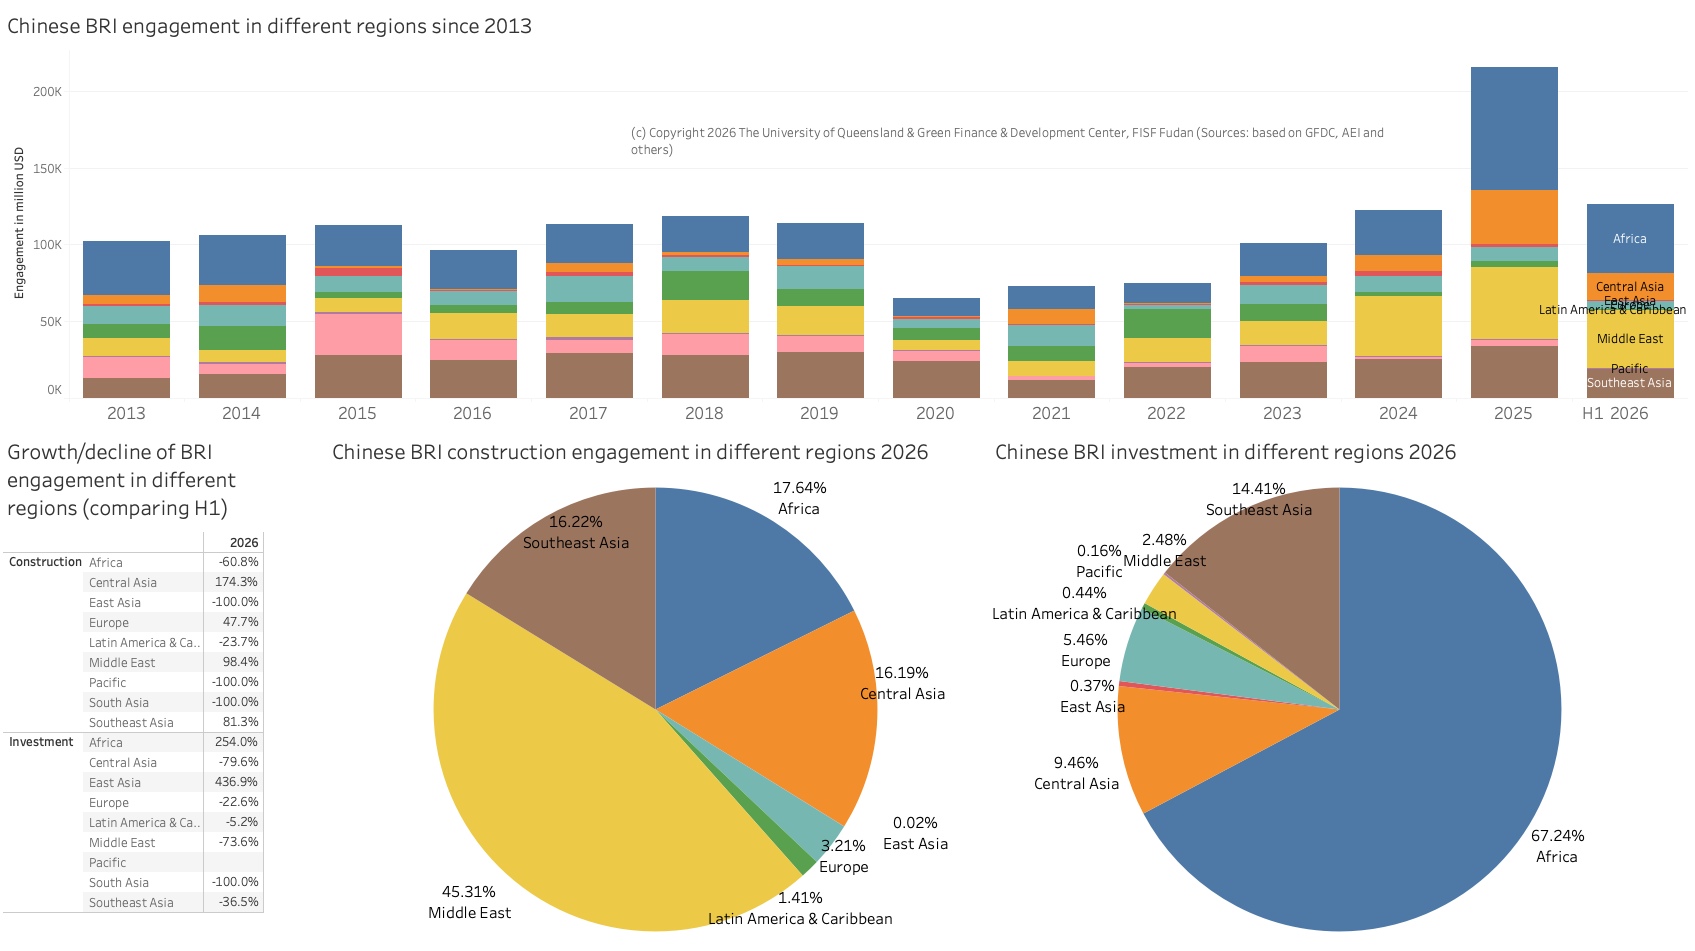
African BRI countries are top destination for Chinese BRI engagement, almost tripling Chinese BRI investment announcements compared to H1 2025.
East Asia investment announcements more than quadrupleswhile construction engagement vanishes.
Middle East tops the list of construction engagement with USD 36.5 billion – record levels for any H1 since 2013.
Chinese regional BRI engagement was not evenly distributed among all regions[3] (see Figure 4). China’s regional construction engagement across multiple regions increased significantly compared to H1 2025
- Central Asia: plus 174% to USD 13.2 billion
- Middle East: plus 98.4% to USD 36.5 billion
- Southeast Asia: plus 81.3% to USD 12.3 billion
This compares to various regions that saw no Chinese construction engagement in H1 2026, including in the Pacific, East Asia, South Asia.
Looking at Chinese regional BRI investment, only two regions saw significant growth
- East Asia: plus 437% to USD 182 million (from USD 34 million in H1 2025)
- Africa: plus 254% to USD 33.5 billion
All other regions saw varying levels of decreases of Chinese BRI investment: Pacific countries continue to see almost no Chinese engagement since 2019 for investment and construction. Similarly, Latin American countries continue to see little Chinese engagement (USD 584 million in construction and USD 219 million in investment). However, China is strongly engaged in Latin America with over USD 800 million investment in Brazil in 2025, albeit Brazil is not a BRI country. BRI countries in South Asia did not receive any Chinese investment announcements in H1 2026.
| Good to know: A reason for Africa’s continued strong engagement may be increasing impacts and risks of tariffs from both the US and the EU where some parts of Africa enjoy lower tariffs due to EU or US investments in the region. An example is Morocco where car makers from both the EU and China are investing to utilize lower manufacturing cost and proximity to the EU market. |
Country analyses of Chinese BRI engagement
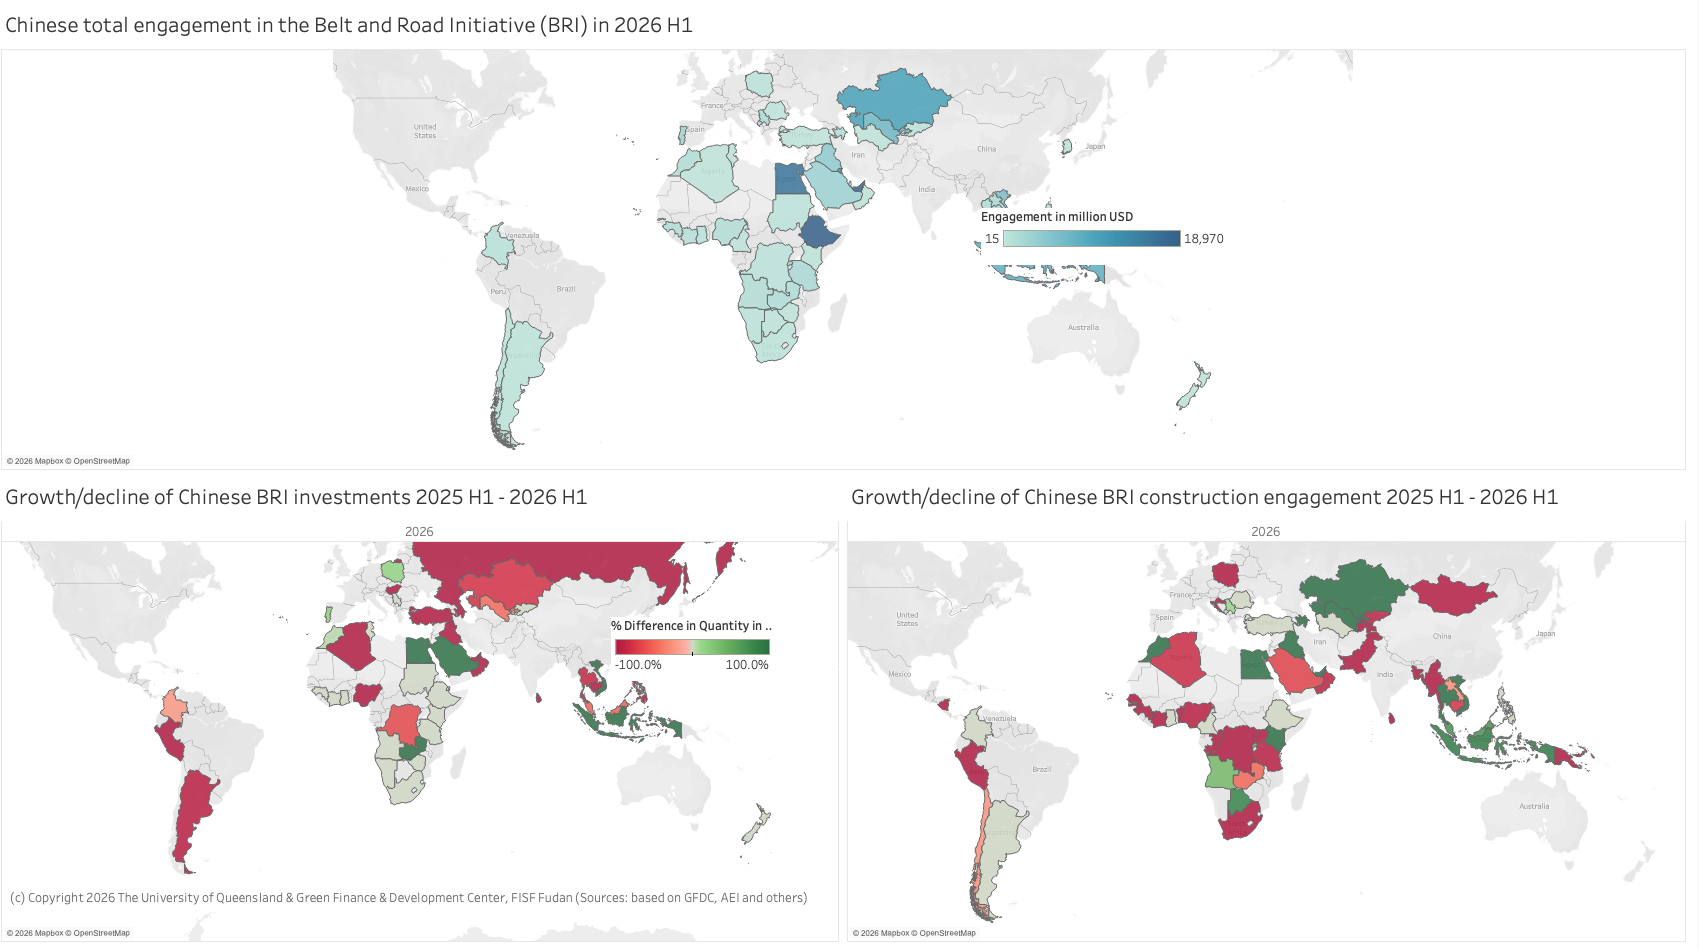
China’s financing and investment spread across 67 BRI countries in H1 2026 (down from 71 in H1 2025), with 42 (down from 45) countries receiving investments and 49 (down from 51) with construction engagement.
The countries with the largest growth in total BRI engagement were Ethiopia (+USD 18.9 billion), UAE (+USD 11.2 billion), Kuwait (+USD 10.8 billion), Egypt (+USD 9.7 billion), and Vietnam (+USD 5.9 billion).
The country with the highest construction volume in H1 2026 was UAE with about USD 18.4 billion (up from 7 billion in H1 2025), followed by Kuwait (USD 11.5 billion), Uzbekistan (USD 6.1 billion) and Vietnam (USD 5.4 billion).
Interestingly, Pakistan, a key BRI country, saw no construction contract in H1 2026.
Regarding BRI investments announcements, Ethiopia saw two significant announcements on green energy generation and green energy manufacturing worth USD 14.8 billion in H1 2026. Similarly, Egypt is again an outperformer receiving growing investments announcements to USD 12.2 billion. Other notable countries are Kazakhstan (USD 4.4 billion) and Indonesia (USD 2.8 billion). Pakistan received no investment announcements.17 countries saw a 100% drop of BRI engagement compared to H1 2025, including Pakistan, Peru, Bangladesh, Russia, and Sri Lanka (see Figure 5).
Sector trends of Chinese BRI engagement H1 2026
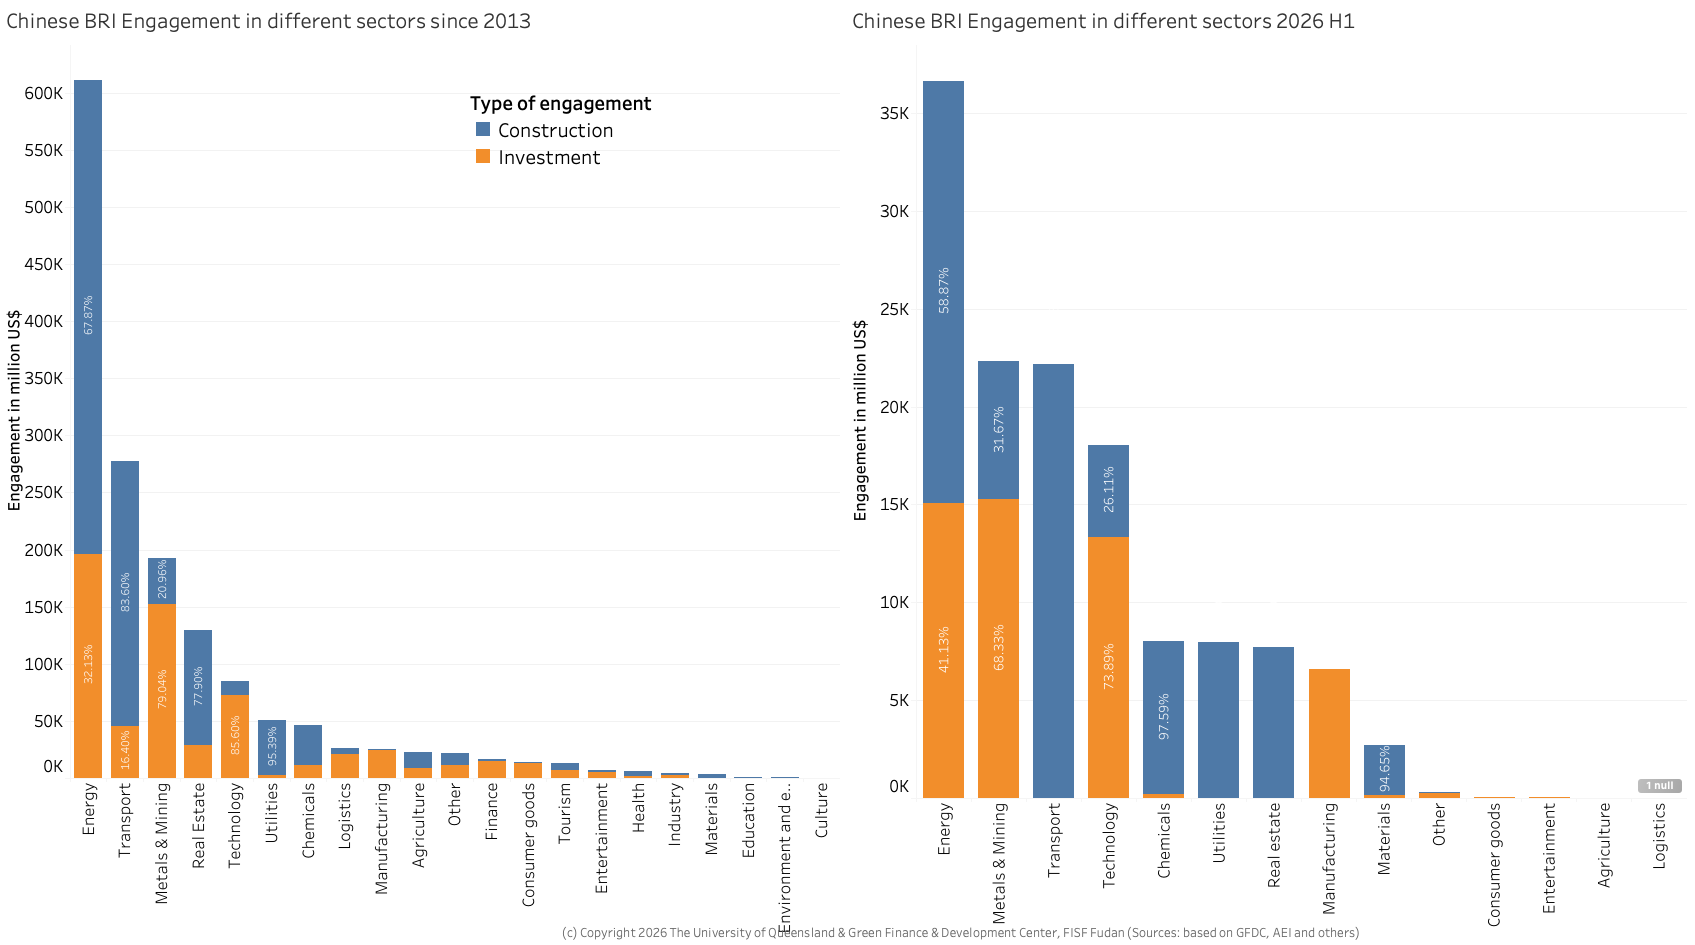
In H1 2026, particularly the transport sector (+ USD 10.6 billion), utilities (+ USD 5.5 billion), and chemicals (+ USD 3 billion) grew compared to H1 2025, while real estate dropped by USD 7 billion.
The focus of China’s overseas BRI engagement continued to be in energy (28.7% of total) with a significant decline from 2025 when the energy sector constituted 43.5% of Chinese BRI engagement. Compared to 2025, the transport sector showed some resilience and grew to reach 14.4% of the share of BRI engagement (compared to e.g., 6.1% in all of 2025 and a high of 28% in 2018). Meanwhile, the metals and mining sector kept its role as the second largest sector with about 17.2% of total (up from 15% in 2025), while the share of the technology sector expanded from 8.5% in 2025 to 13.4% in H1 2026 (see Figure 6).
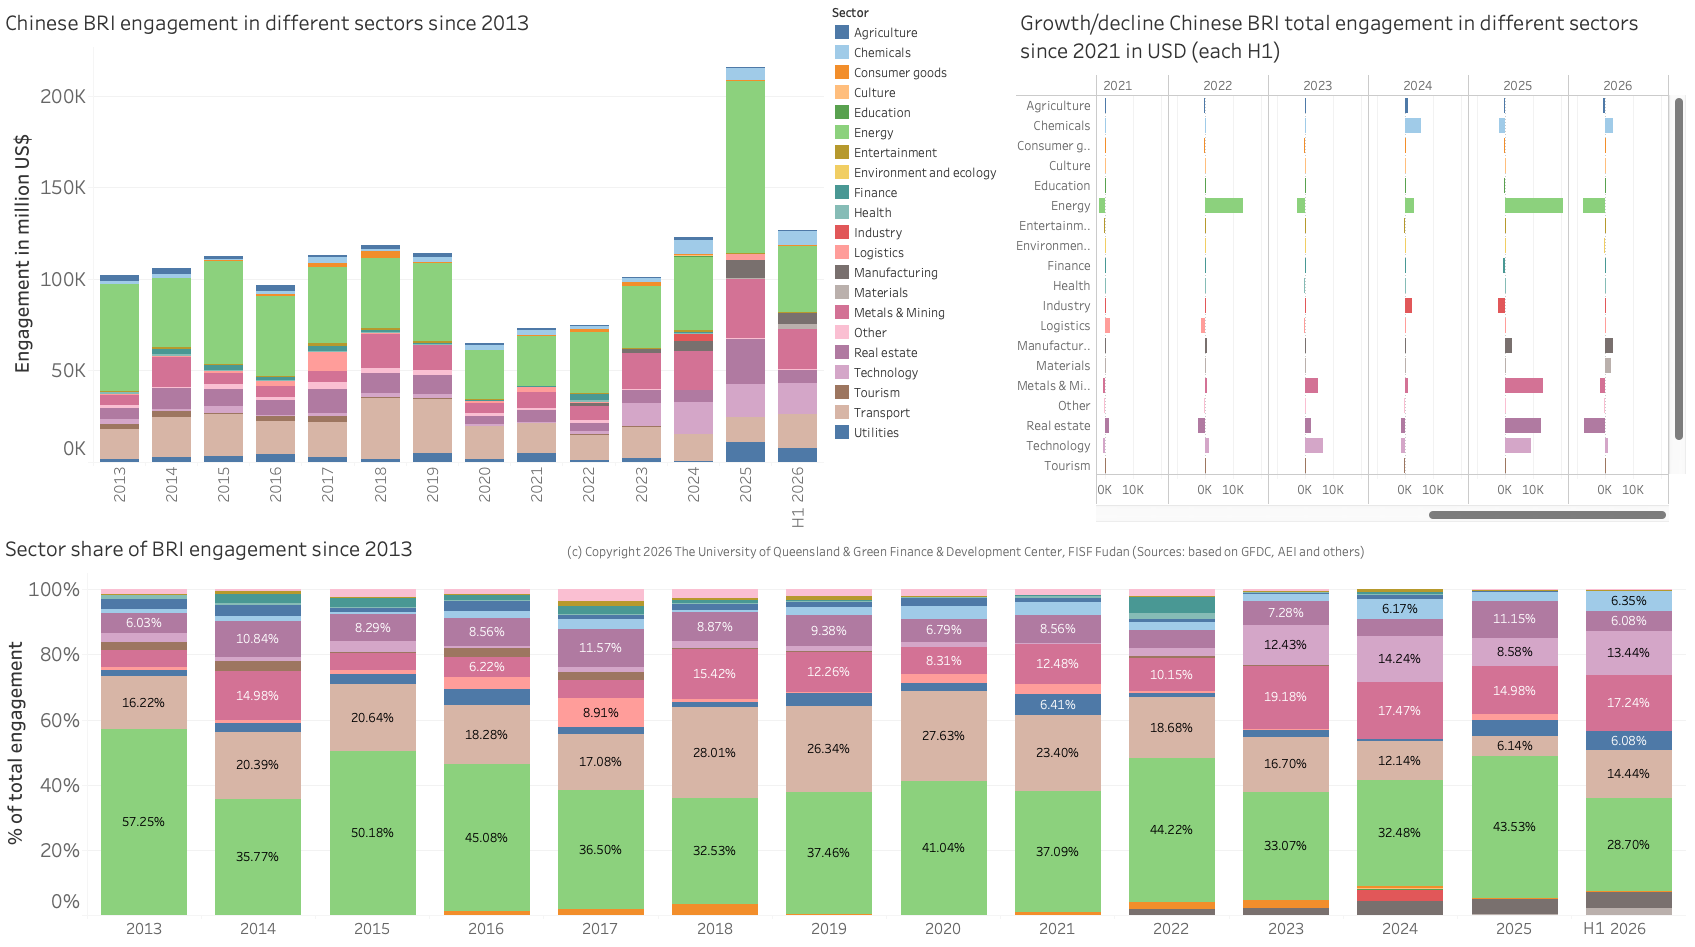
When comparing construction and investment in different sectors, some interesting trends emerge with a prevalence for investment over construction engagement
- Metals and Mining (68% investment in H1 2026)
- Technology (74% investment in h1 2026)
- Manufacturing (100% investment in H1 2026)
Meanwhile, the transport sector, the real estate sector and utilities are typically driven by construction engagement (see Figure 7).
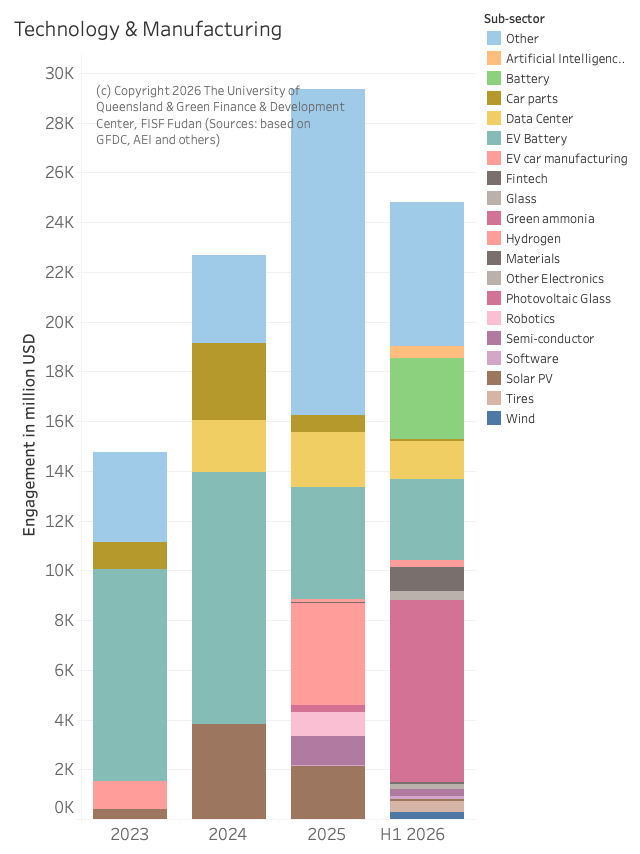
Technology and manufacturing engagement in the BRI 2026 H1
Technology and manufacturing as key growth sectors for Chinese BRI engagement reached record levels in H1 2026: Chinese engagement in in these sectors growing by about 11% (technology) and 81% (manufacturing) compared to 2025 H1 to USD 17 billion and USD 6.5 billion, respectively. Apart from general manufacturing, the technology investment saw strong increases is utility scale batteries, and significant investment in green ammonia (in Ethiopia), after significant investment in green hydrogen production in 2025 in the BRI. Solar PV manufacturing engagement continued to drop in 2026 (see Figure 8).
Notable engagements include a USD 2.6 billion construction contract in Indonesia for a battery factory delivered by BYD, or a USD 2.4 billion battery park in Portugal.
Importantly, Chinese companies are also strongly engaging outside the BRI in the tech sector, including in the USA (e.g., LONGi co-invested with Neovolta in the USA for batteries) or a USD 2.5 billion deal between Fortescue and BYD to build a battery storage system in Australia.
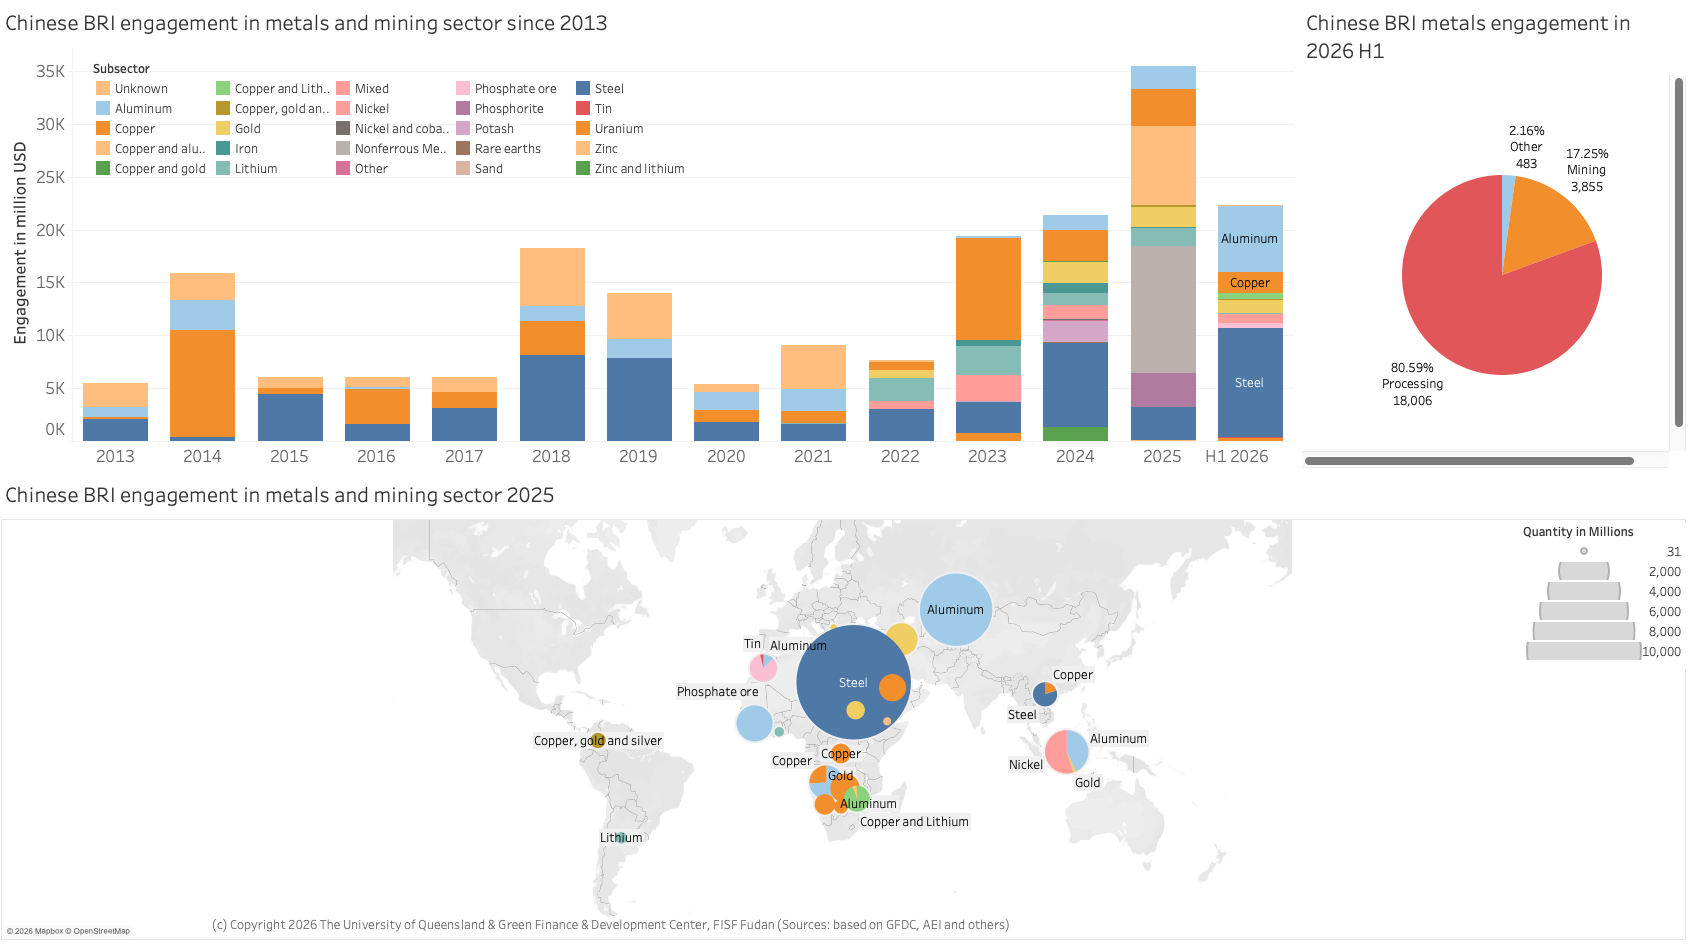
Metals and mining engagement in the Belt and Road Initiative 2026 H1
China’s engagement in metals and mining reached a record high of USD 21.8 billion in 2026 H1, which is higher than in any full year since 2013 but 2025.
Egypt was the most important recipient of Chinese metals and mining engagement with a USD 10 billion steel mill. Kazakhstan continues to be a most important partner for Chinese metals and mining, seeing announcement for two aluminum processing facilities worth USD 2.5 billion.
Indonesia, which was a top recipient of Chinese engagement for metals and mining for many years, could increase collaboration with China to a total of USD 1.4 billion in nickel, gold, and aluminum.
| Good to know: An interesting development is the focus on aluminum in the first half of 2026. An explanation can be use of aluminum in long-distance transmission lines as well as its use in the automotive sector. |
It is important to note that in 2026 H1, the share of processing facilities (e.g., smelters) of the total (e.g., vis-à-vis mining) was about 80%, with 85% of the investment (about USD 13 billion) went to processing related activities (see Figure 9). This is different form 2025, where a about 43% of China’s engagement went to support mining activities.
Energy-related engagement in the BRI at the greenest ever recorded – more than 50% green, new coal fired power plant
China BRI Energy Overview
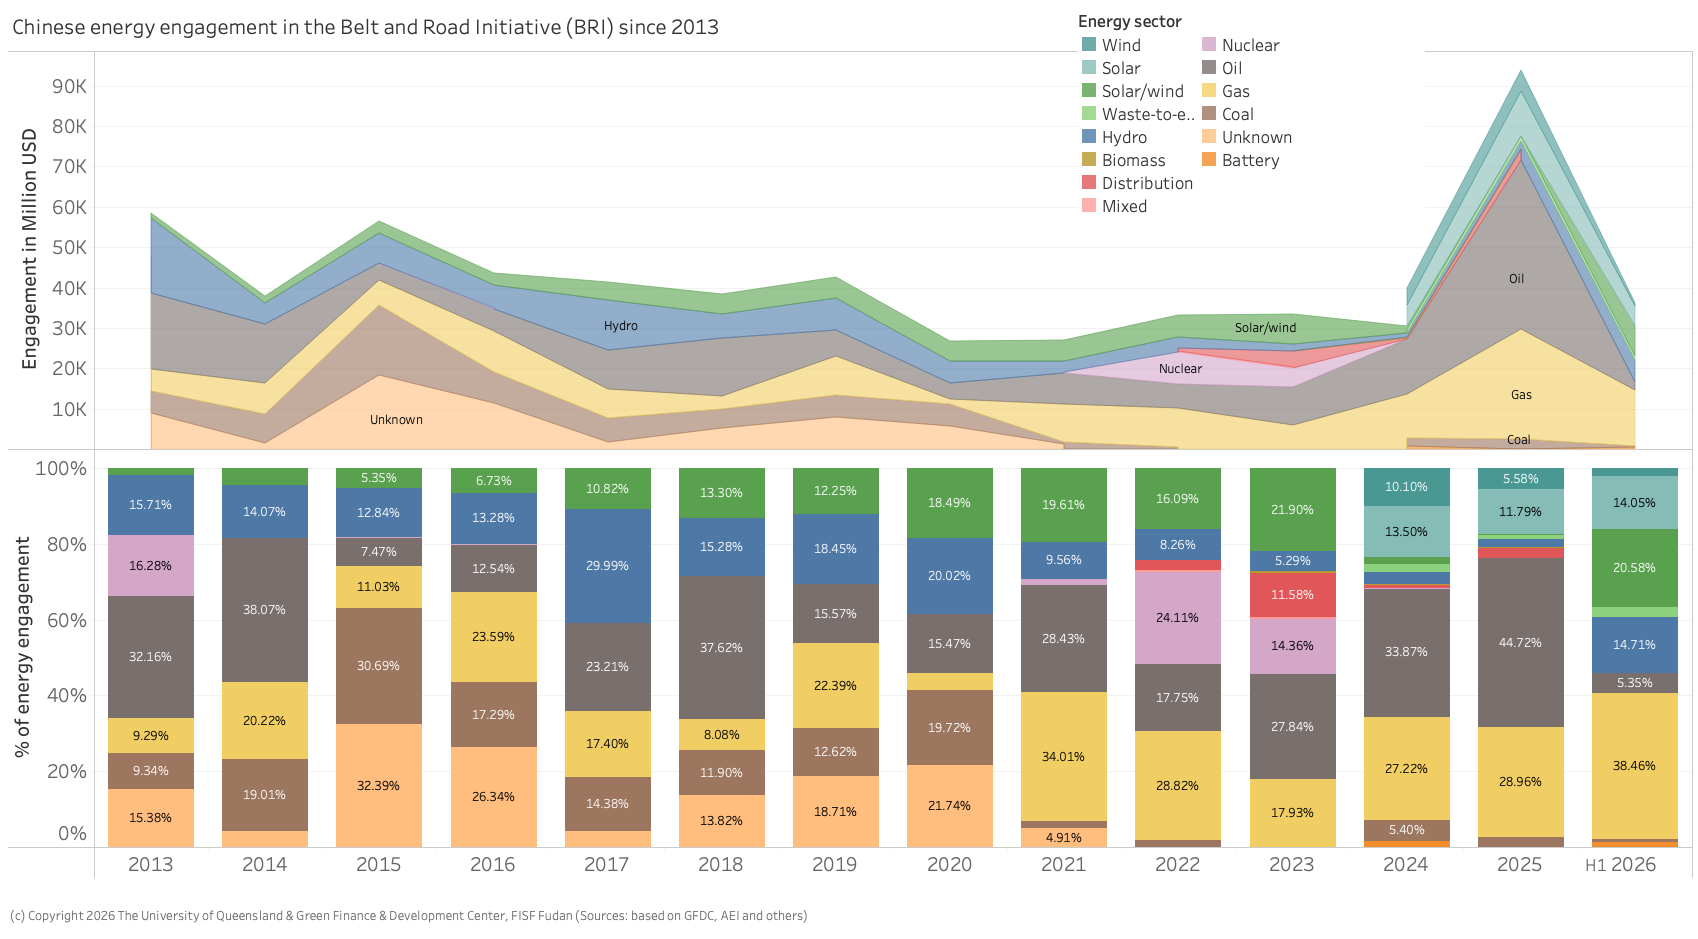
China’s energy-related engagement in 2026 H1 set a record as the greenest since the BRI’s inception in 2013 in absolute and relative terms.
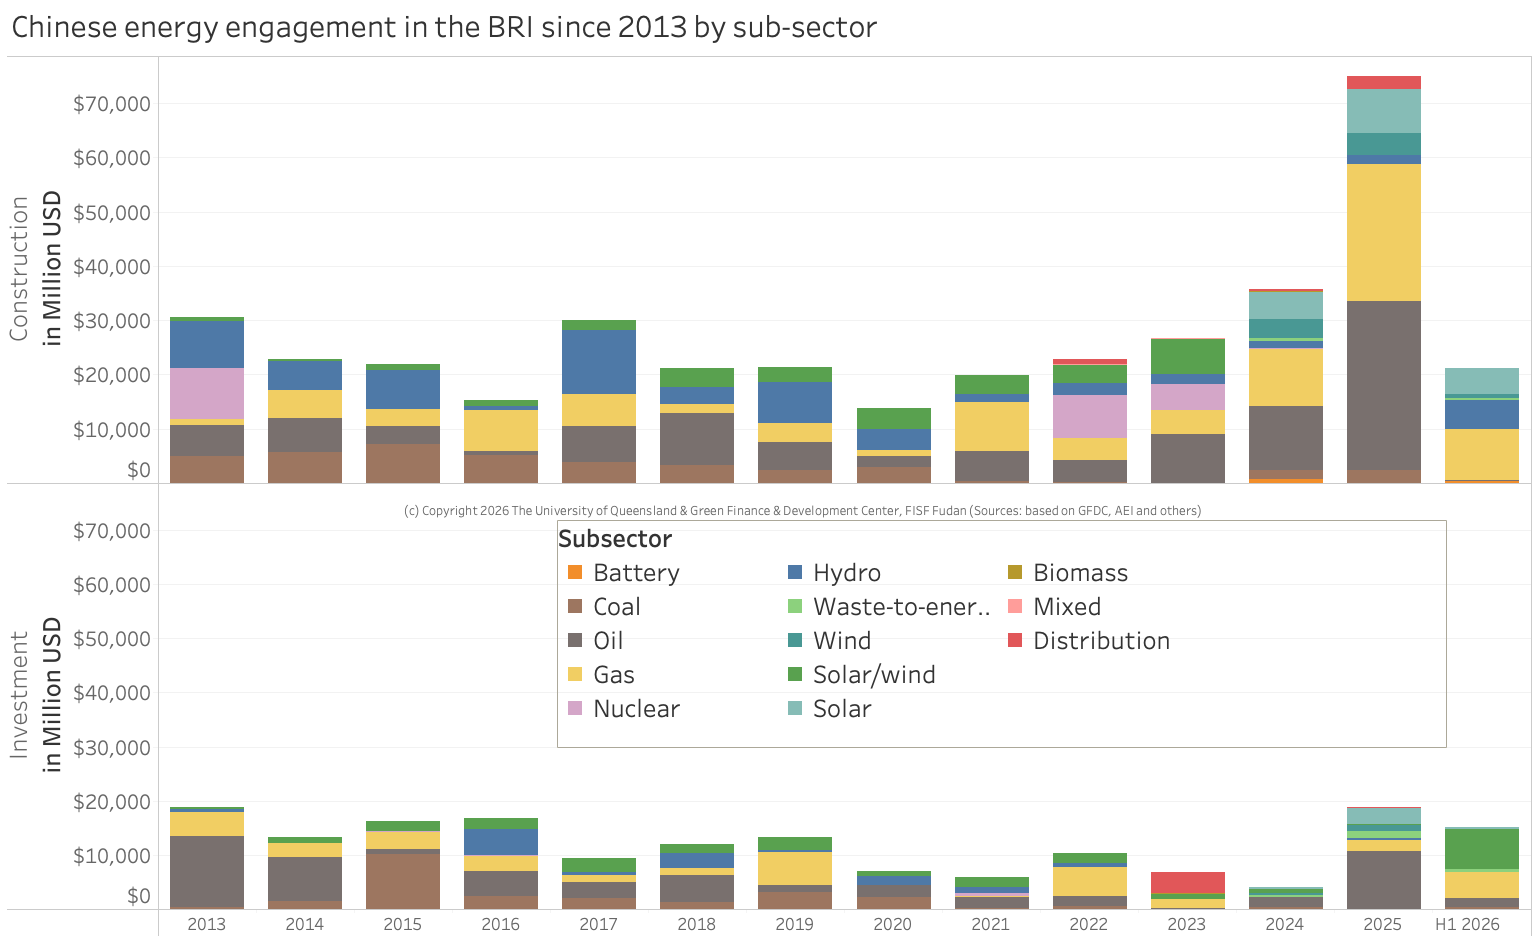
In 2026 H1, China’s energy engagement was about USD36.3 billion, which is almost double the energy engagement in any first half year since 2013 except for 2025 (see Figure 10).
China’s engagement in green energy has also seen the highest since 2013 – with USD 14.3 billion in wind, solar, and waste-to-energy plus USD 5.3 billion in hydro.
While China continued its engagement in fossil fuels, particularly gas, but also coal with a new 600 MW coal fired power plant construction in Zambia announced in June4. Total fossil engagement was about USD 16.2 billion – the which is the second highest levels since 2020 (apart from 2025).
No engagement in distribution systems (e.g., substations, power lines, storage) was recorded in 2026 H1, but some battery storage projects. Cumulatively, since 2020, oil engagement topped gas engagement with USD 84.4 billion versus USD 78 billion. Solar and wind engagement reached USD 62.7 billion and has far surpassed coal, which still received about USD 11 billion despite the 2021 no coal pledge (hydro adds another USD 21 billion).
Coal
Following China’s announcement in September 2021 to not to build new coal fired power plants, China continued to engage in new coal-fired power projects seem to progress (e.g., Indonesia, Bangladesh Barisal 2, Gacko II in Bosnia).
2026 saw a continued engagement in coal-related engagement through mining operations. In June, a new 600 MW coal plant was announced in Zambia with Ziquan Group Singapore Pte Limited identified as the construction company. However, while this is an announcement, the plant still requires several approval steps.
Oil and gas
Oil and gas engagement continued to be an important part of BRI engagement reaching USD 14 billion for gas and USD 1.9 billion for oil. This is, however, a significant drop from 2025 H1 (USD 23.3 billion for gas, USD 6.9 billion for oil).
As for investments, a major deal was the USD 3.9 billion investment by Sinopec Geo-Jade Petroleum in Kazakhstan to explore a new gas field.
Meanwhile, most oil-related projects were related to processing and transportation (pipeline). This includes projects, such as the USD 1.8 billion investment into the 100,000 barrels per day (bpd) refinery in Indonesia by Nanshan Group.
Green energy and hydropower
China’s total engagement in green energy (solar, wind, waste-to-energy) and hydropower reached approximately USD20.1 billion in H1 2026, up from USD9.8 billion in H1 2025 (and USD20.7 billion in all of 2025, a previous record year).
Looking at investment only, Chinese green energy and hydropower investment increased to USD8.3 billion in H1 2026 (compared to USD5.9 billion in all of 2025 and USD1.5 billion in 2024). Meanwhile, construction projects related to green energy (including hydropower) increased to USD11.3 billion plus USD 442 million for battery storage. This compares to USD13.7 billion in all of 2025 and USD10.3 billion in all of 2024 (see Figure 11).
Energy sources varied
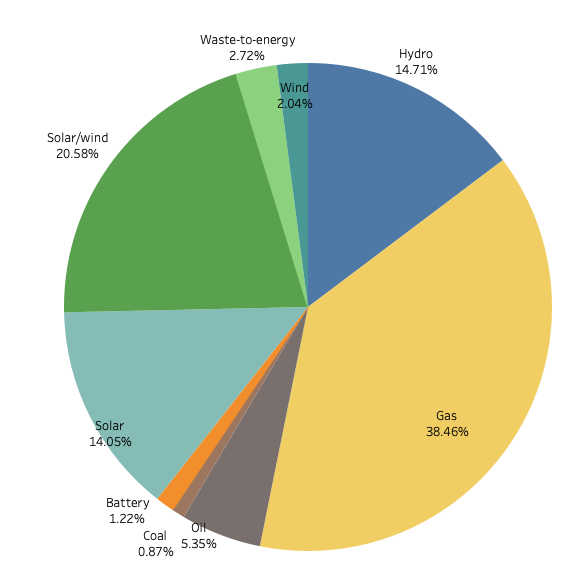
A more detailed analysis of energy sources revealed that China is engaging in a diverse range of energy projects. For the first time in multiple years, renewable energy sources took the majority (56%) of total energy engagement, while fossil is less than 50% in 2026 H1 (38% in gas, 5% in oil, and 1% coal related engagement) (see Figure 12).
Energy engagement across the supply chain
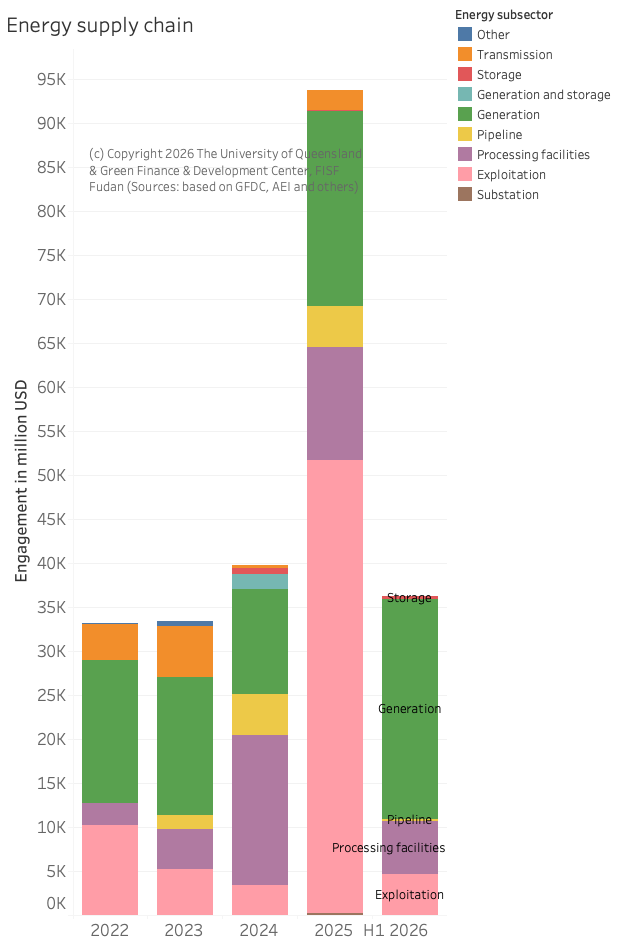
In 2026 H1, China’s engagement across the energy supply chain has focused on electricity generation, which took 69% of total engagement (or USD25 billion). This is different from the previous two years when fossil fuel related engagement in exploitation, processing facilities, and pipeline projects were dominant (see Figure 13).
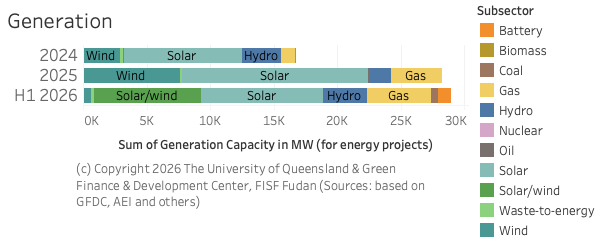
Looking at Chinese engagement in electricity generation only, Chinese engagement in 2026 H1 (USD25 billion) beat the total energy generation engagement of all of 2025 (USD22 billion). This engagement promises to add about 28 GW of generation capacity: 9.6 GW in solar, 8.4 GW in solar/wind combined, 3.4 GW in hydro, and 5 GW in gas projects (see Figure 14).
Energy engagement in different countries
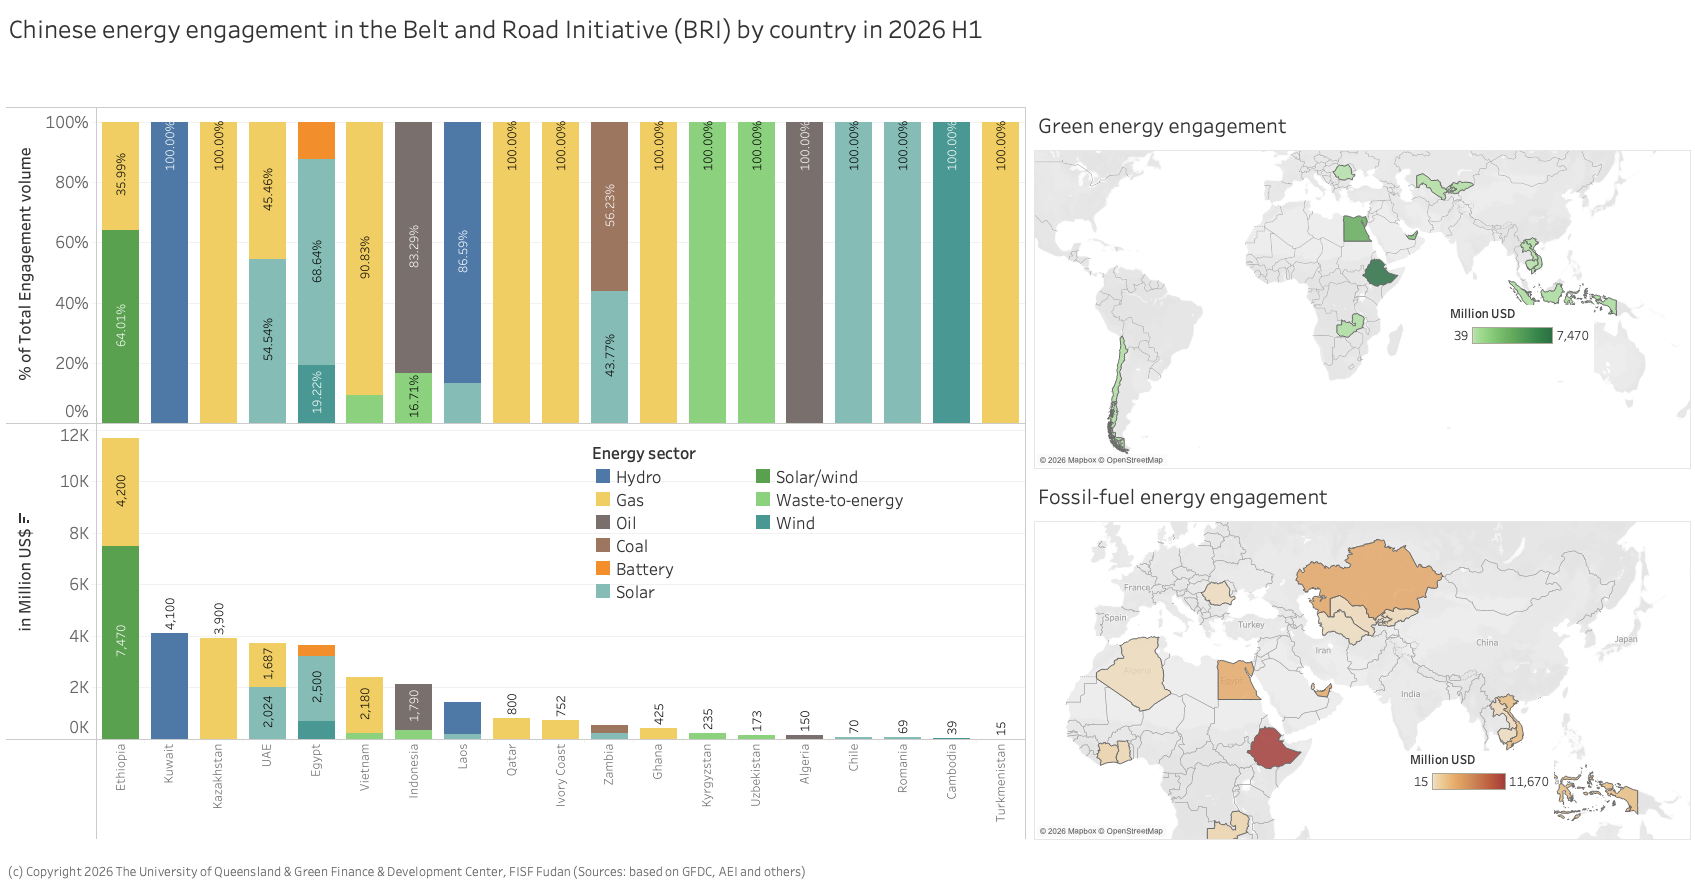
In 2026 H1, Ethiopia was the BRI country with the highest Chinese energy engagement, driven by USD 7.4 billion green energy development agreement between the Ethiopian Investment Commission (EIC) and China’s Mingyang Smart Energy Group, which marks one of the largest private foreign direct investments in Ethiopia’s history. Initially introduced as a USD 10 billion Memorandum of Understanding at the 4th “Invest in Ethiopia” Forum earlier in the year, the scope was officially expanded and licensed in May 2026 to a total revised investment of USD 14.17 billion (including green ammonia production facilities). The energy generation of Phase 1 allocates USD 7.47 billion toward physical generation assets to diversify Ethiopia’s energy matrix, which relies heavily on hydropower (see Figure 15). Kuwait saw a USD 4.1 billion hydropower and desalination project with PowerChina.
Cumulatively since 2013, Pakistan remains the country with the highest Chinese energy engagement worth over USD 41.5 billion followed by Saudi Arabia with about USD 40 billion and Nigeria (USD 28 billion).
Transport-related engagement in the Belt and Road Initiative (BRI) 2026 H1
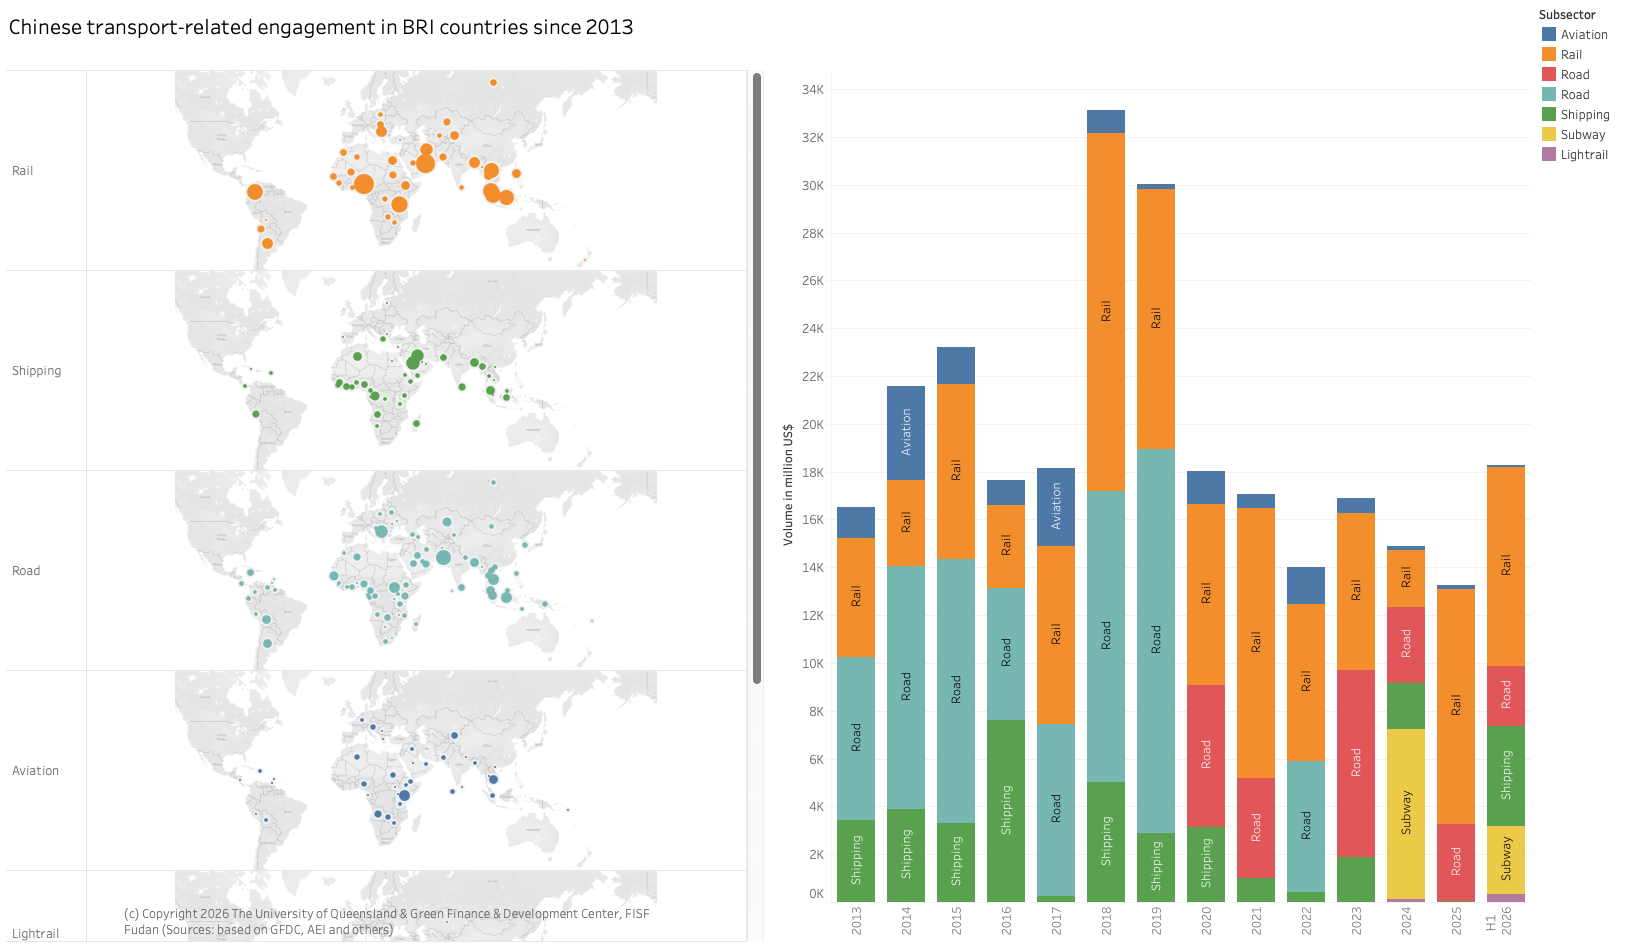
Transport-related engagement has long been a cornerstone of facilitating trade between China and the BRI countries, and trade is a core component of the BRI. To support this, China has invested in and developed projects in road, rail, aviation, shipping, and logistics across the world (see Figure 16).
In 2026 H1, transport related engagement saw significant growth compared to previous years – with the first half seeing more engagement than any full year since 2020. It is noteworthy that in 2026 H1 all transportation projects are commissioned through construction contracts (rather than investment).
Aviation: One project was announced totaling USD58 million, which is support for the Phu Quoc International Airport in Vietnam.
Rail: Total rail engagement (including light rail and subway) was worth USD11.7 billion (more than in all of 2025) the Dubai High Speed Railway projects stands out with involvement from State Construction Engineering and China Communications Construction Company (CCCC) worth about USD8 billion. In Vietnam, China Railway Engineering (CREC) signed the construction deal for the second metro line in Ho Chi Minh City worth USD2 billion.
Road transport: China continues to engage in road construction projects across multiple BRI countries, with a total value of USD2.5 billion in 2026 H1. Noteworthy is the USD1.5 billion agreement with Serbia to construct the Vožd Karadjordje Expressway. Ports: About USD4.2 billion in shipping related project was found in 2026 H1 in BRI countries, most notably the EPC General Contracting Contract for the First Phase of the Mubarak Port Project in Kuwait worth USD4.1 billion.
Major players in China’s Belt and Road Initiative (BRI) – a growing dominance of private enterprises over state-owned enterprises
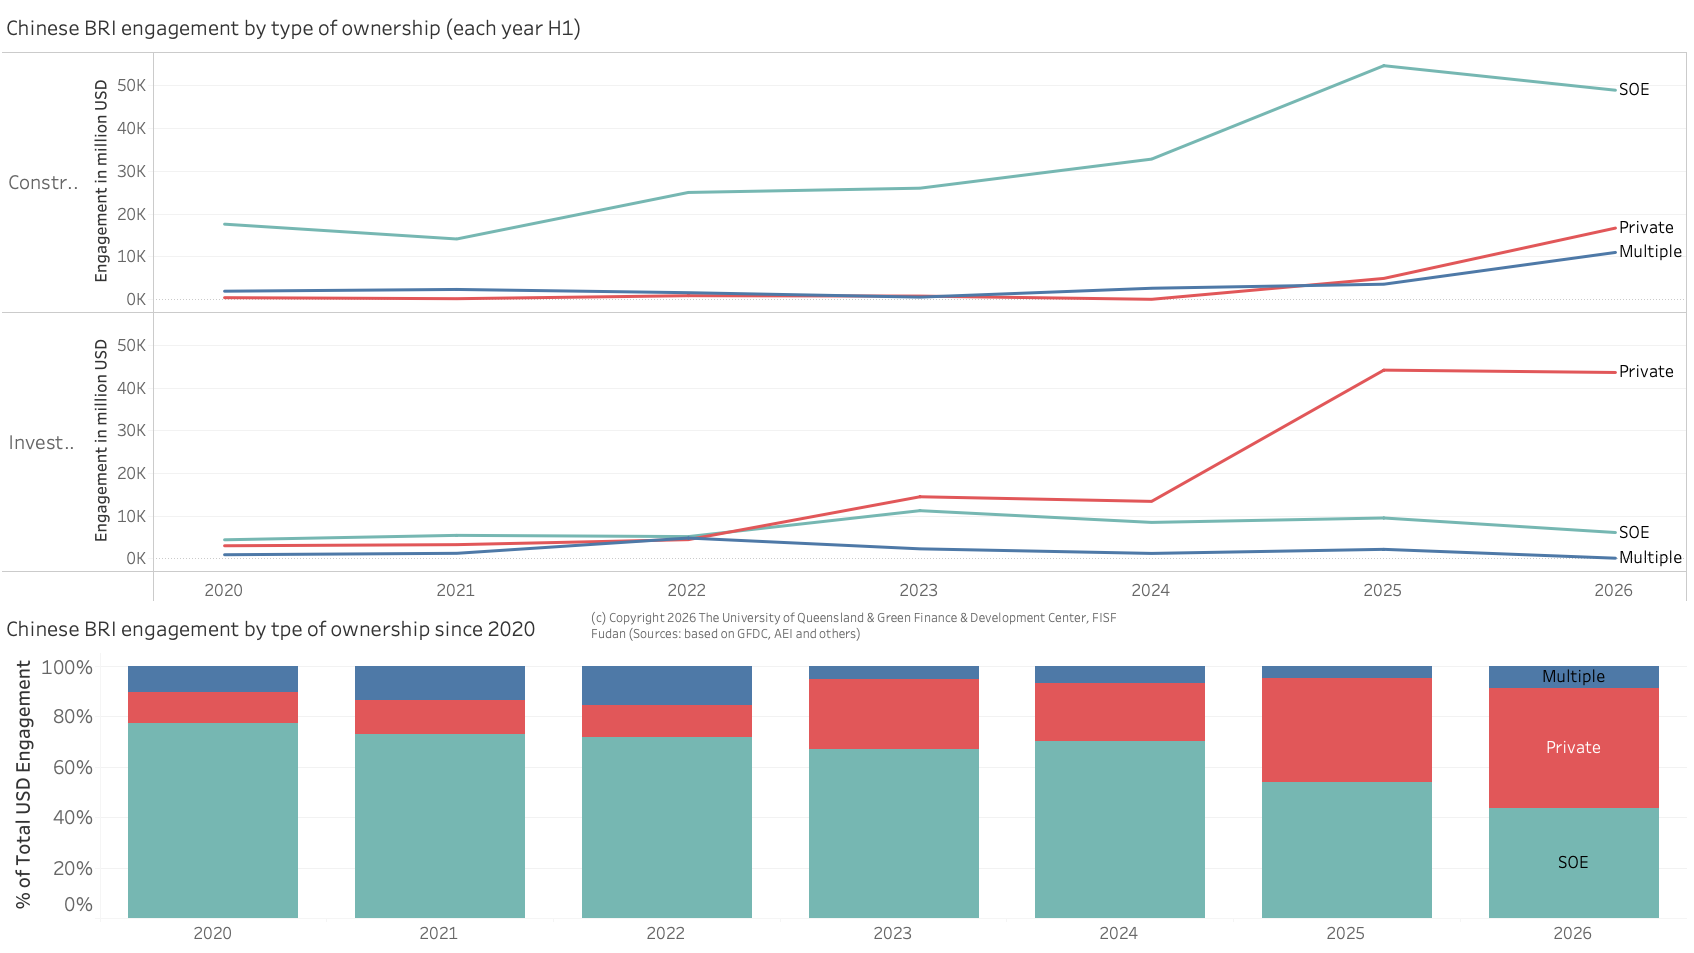
In 2026 H1, Chinese private enterprises took a dominant role in investment and growth in construction projects.
Privately owned Chinese companies (as opposed to Chinese provincial or central state-owned enterprises, SOEs) play an ever more important role in delivering projects and investing in BRI countries. The share of private sector companies of total engagement (USD) grew from 12.5% in 2020 to 47.7% in 2026 H1.
Particularly since 2025, with a rapidly growing investment portfolio, private companies have taken the lead in providing finance, often from their balance sheets. Meanwhile, SOEs remain dominant for construction projects, where their footprint is about 3 times bigger than those of private companies. Yet, the gap is narrowing in 2026 H1, with the multiple shrinking from 11 in 2025 H1 (see Figure 17).
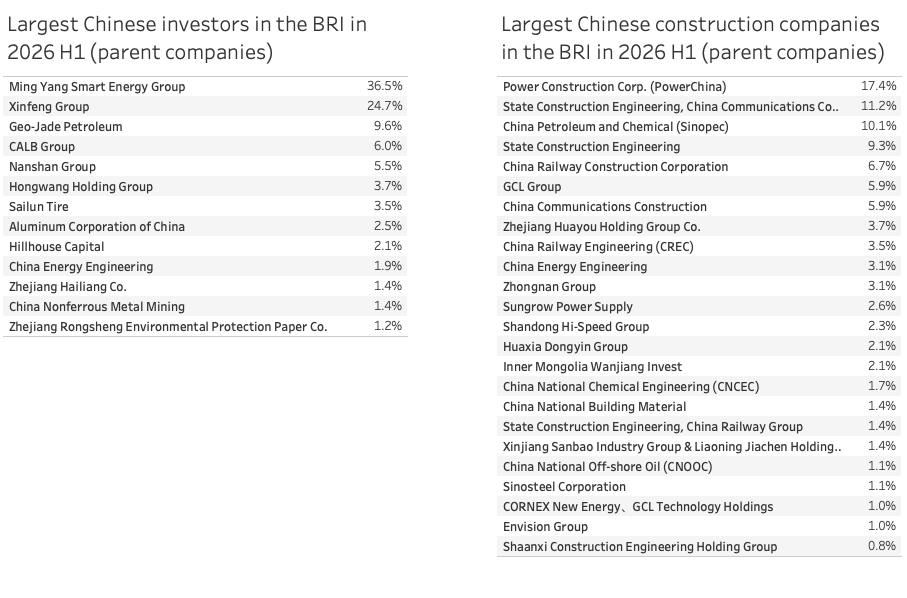
For investment projects, Ming Yang Smart Energy Group and Xinfeng led ahead of Geo Jade Petroleum and CALB Group (all private companies). The Chinese companies most prominently featured in construction projects in the BRI in 2026 H1 were PowerChina, State Construction Engineering and China Communications Construction Corporation, and followed by Sinopec (all SOEs). Private companies like Sungrow and Envision also played an important role in 2026 H1.
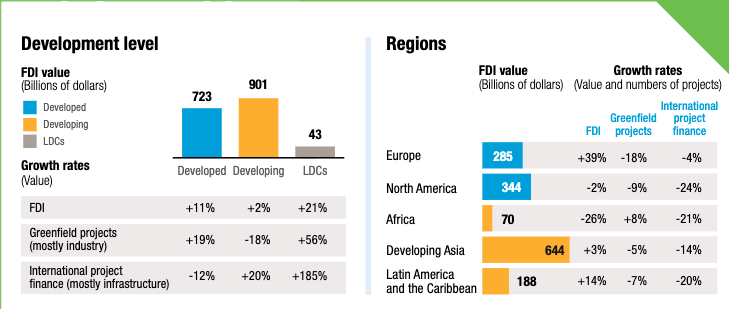
Latest reliable data on FDI in emerging economies encompasses 2025: UNCTAD7 reports in its World Investment Report that global FDI rose by 6% to USD1.6 trillion in 2026. Most of the FDI went to developing countries (USD901 billion) as compared to developed countries (USD723 billion).
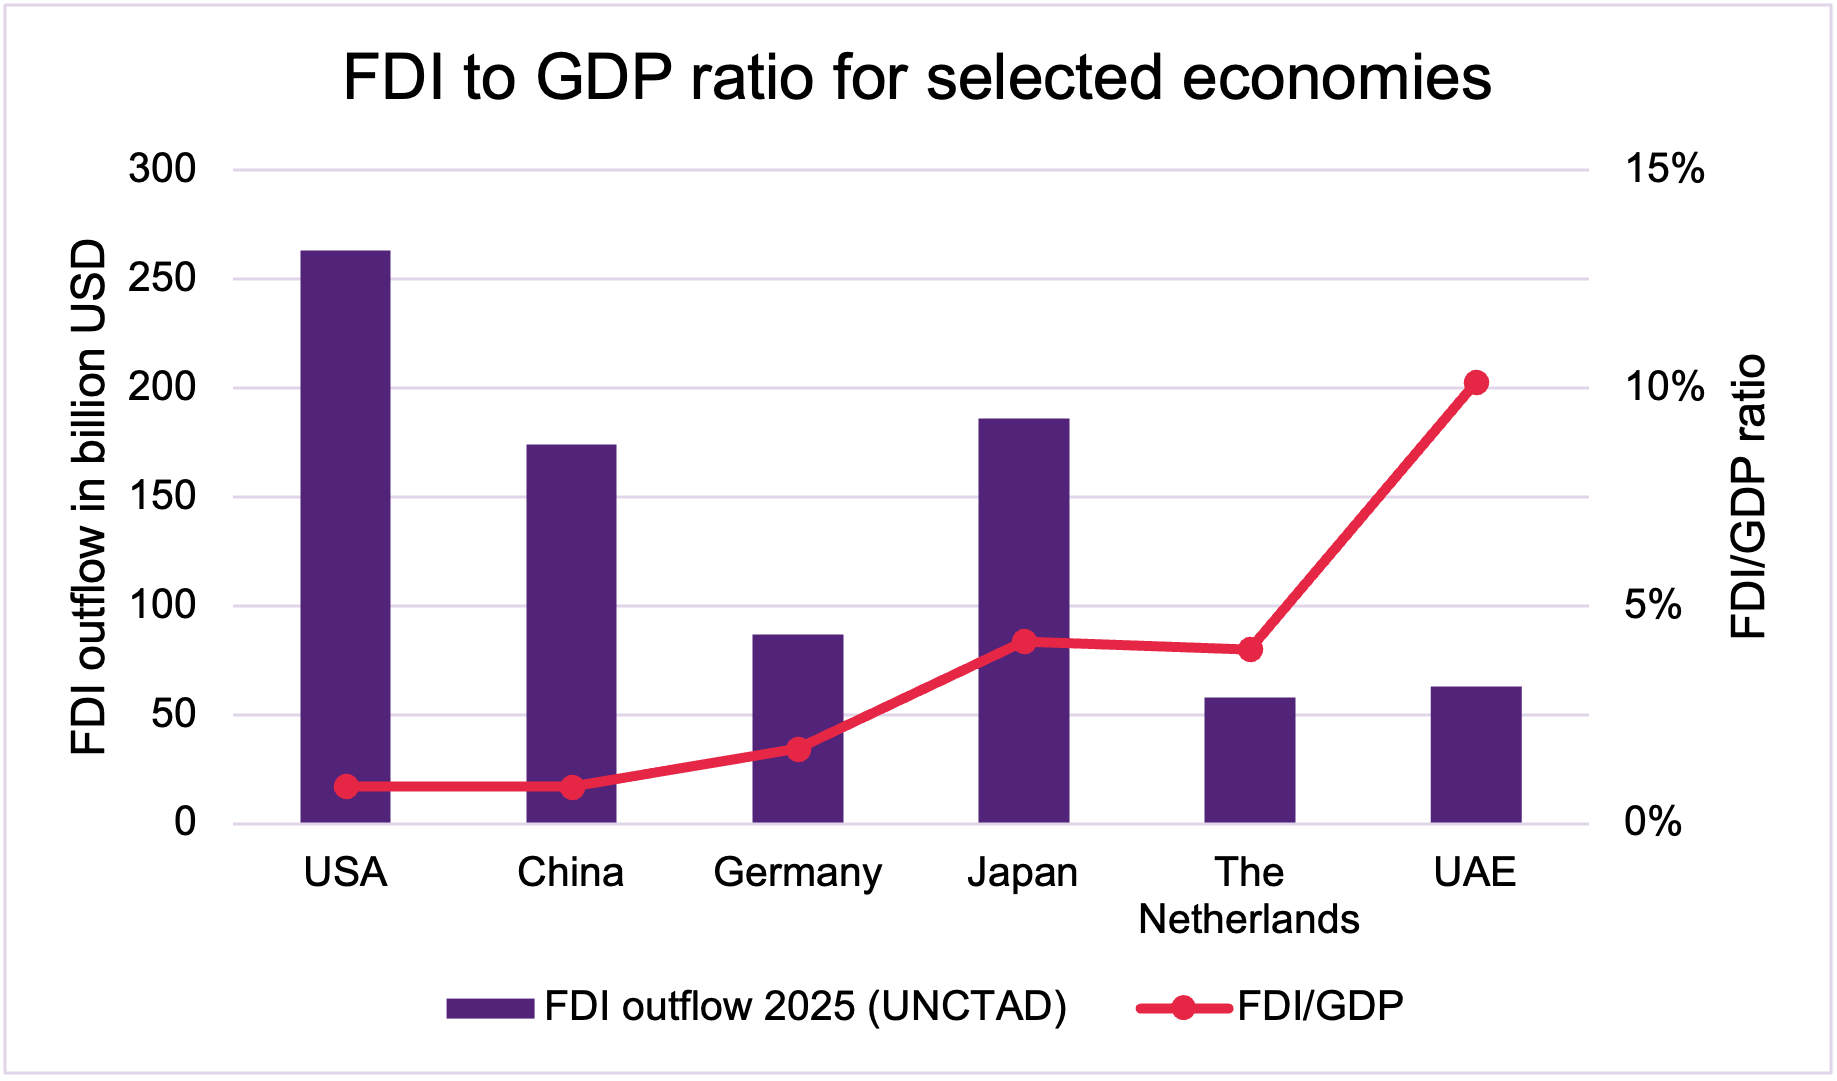
Mian recipients were USA, Singapore, Hong Kong (China), and Brazil. Most important investors were the USA (USD263 billion), Japan (USD186 billion), and China (USD 174 billion) (see Figure 18). Particularly important growth sectors for global FDI are data centers as well as oil and gas exploration, while renewable energy saw some declines.
To understand China’s role for FDI in global comparison, and utilizing only official data, it quickly becomes clear that China’s FDI ratio (i.e., FDI normalized by its GDP) is comparable to that of the USA at about 0.84% and much smaller than those of other export oriented countries like Germany (1.7%), The Netherlands (4.0%), Japan (4.2%), or UAE (10.1%) (see Figure 19).
Outlook for China’s Belt and Road Initiative (BRI) engagement beyond 2026 H1
Chinese finance and investments into the Belt and Road Initiative (BRI) countries in 2026 H1 have continued a similar trajectory to that of the 2025 record year.
For the rest of 2026, a further expansion of BRI investments and construction contracts seems possible despite (or because of) global economic headwinds driven by US-led trade impositions and the fossil fuel volatility driven by the Strait of Hormuz crisis. This can drive investments to boost green energy growth and related industries including continued opportunities for mining and minerals processing deals, technology deals (e.g., EV manufacturing, battery manufacturing) and green energy (e.g., energy production and transmission). China refers to these industries (electric vehicles, batteries and renewable energy) as the “New Three”.
Furthermore, global trade volatilities and uncertainties can spur investments in supply chain resilience and exploration of new markets by Chinese companies. However, risks emerge due to uncertainty of possible growing trade sanctions vis-à-vis China including, possibly, from the European Union (EU) and a risk of secondary sanctions for trade with China should the US aim to pursue this.
Nevertheless, with strong momentum in emerging economies, the mainstay of the BRI, I expect Chinese BRI engagement to continue on strong growth trajectory in 2026.
With strong engagement in sectors requiring significant investment (e.g., mining, manufacturing), and increasing ability to scale energy investment as well as data centers, I expect deal size to also remain large.
About our partner – University of Queensland Asia Pacific Industry Transitions
This report was developed with the University of Queensland (UQ) Business School with a focus on Asia Pacific Industry Transitions.
The Asia Pacific Industry Transitions work at UQ focuses on policy-oriented research to support decision-makers and communities across Asia, Australia, and the Pacific in successfully navigating major industry transformations.
We focus on four critical global trends:
- Energy transitions and climate change
- Artificial intelligence and digitalization
- Geo-economics and the role of China
- Heavy industry transitions, including iron and steel
We are dedicated to driving real-world sustainable impact through research excellence and global partnerships with industry, government, and communities in these areas. Our core deliverables include policy research, market analyses, industry reports, investment and trade databases, capacity building, executive education, and research exchanges.
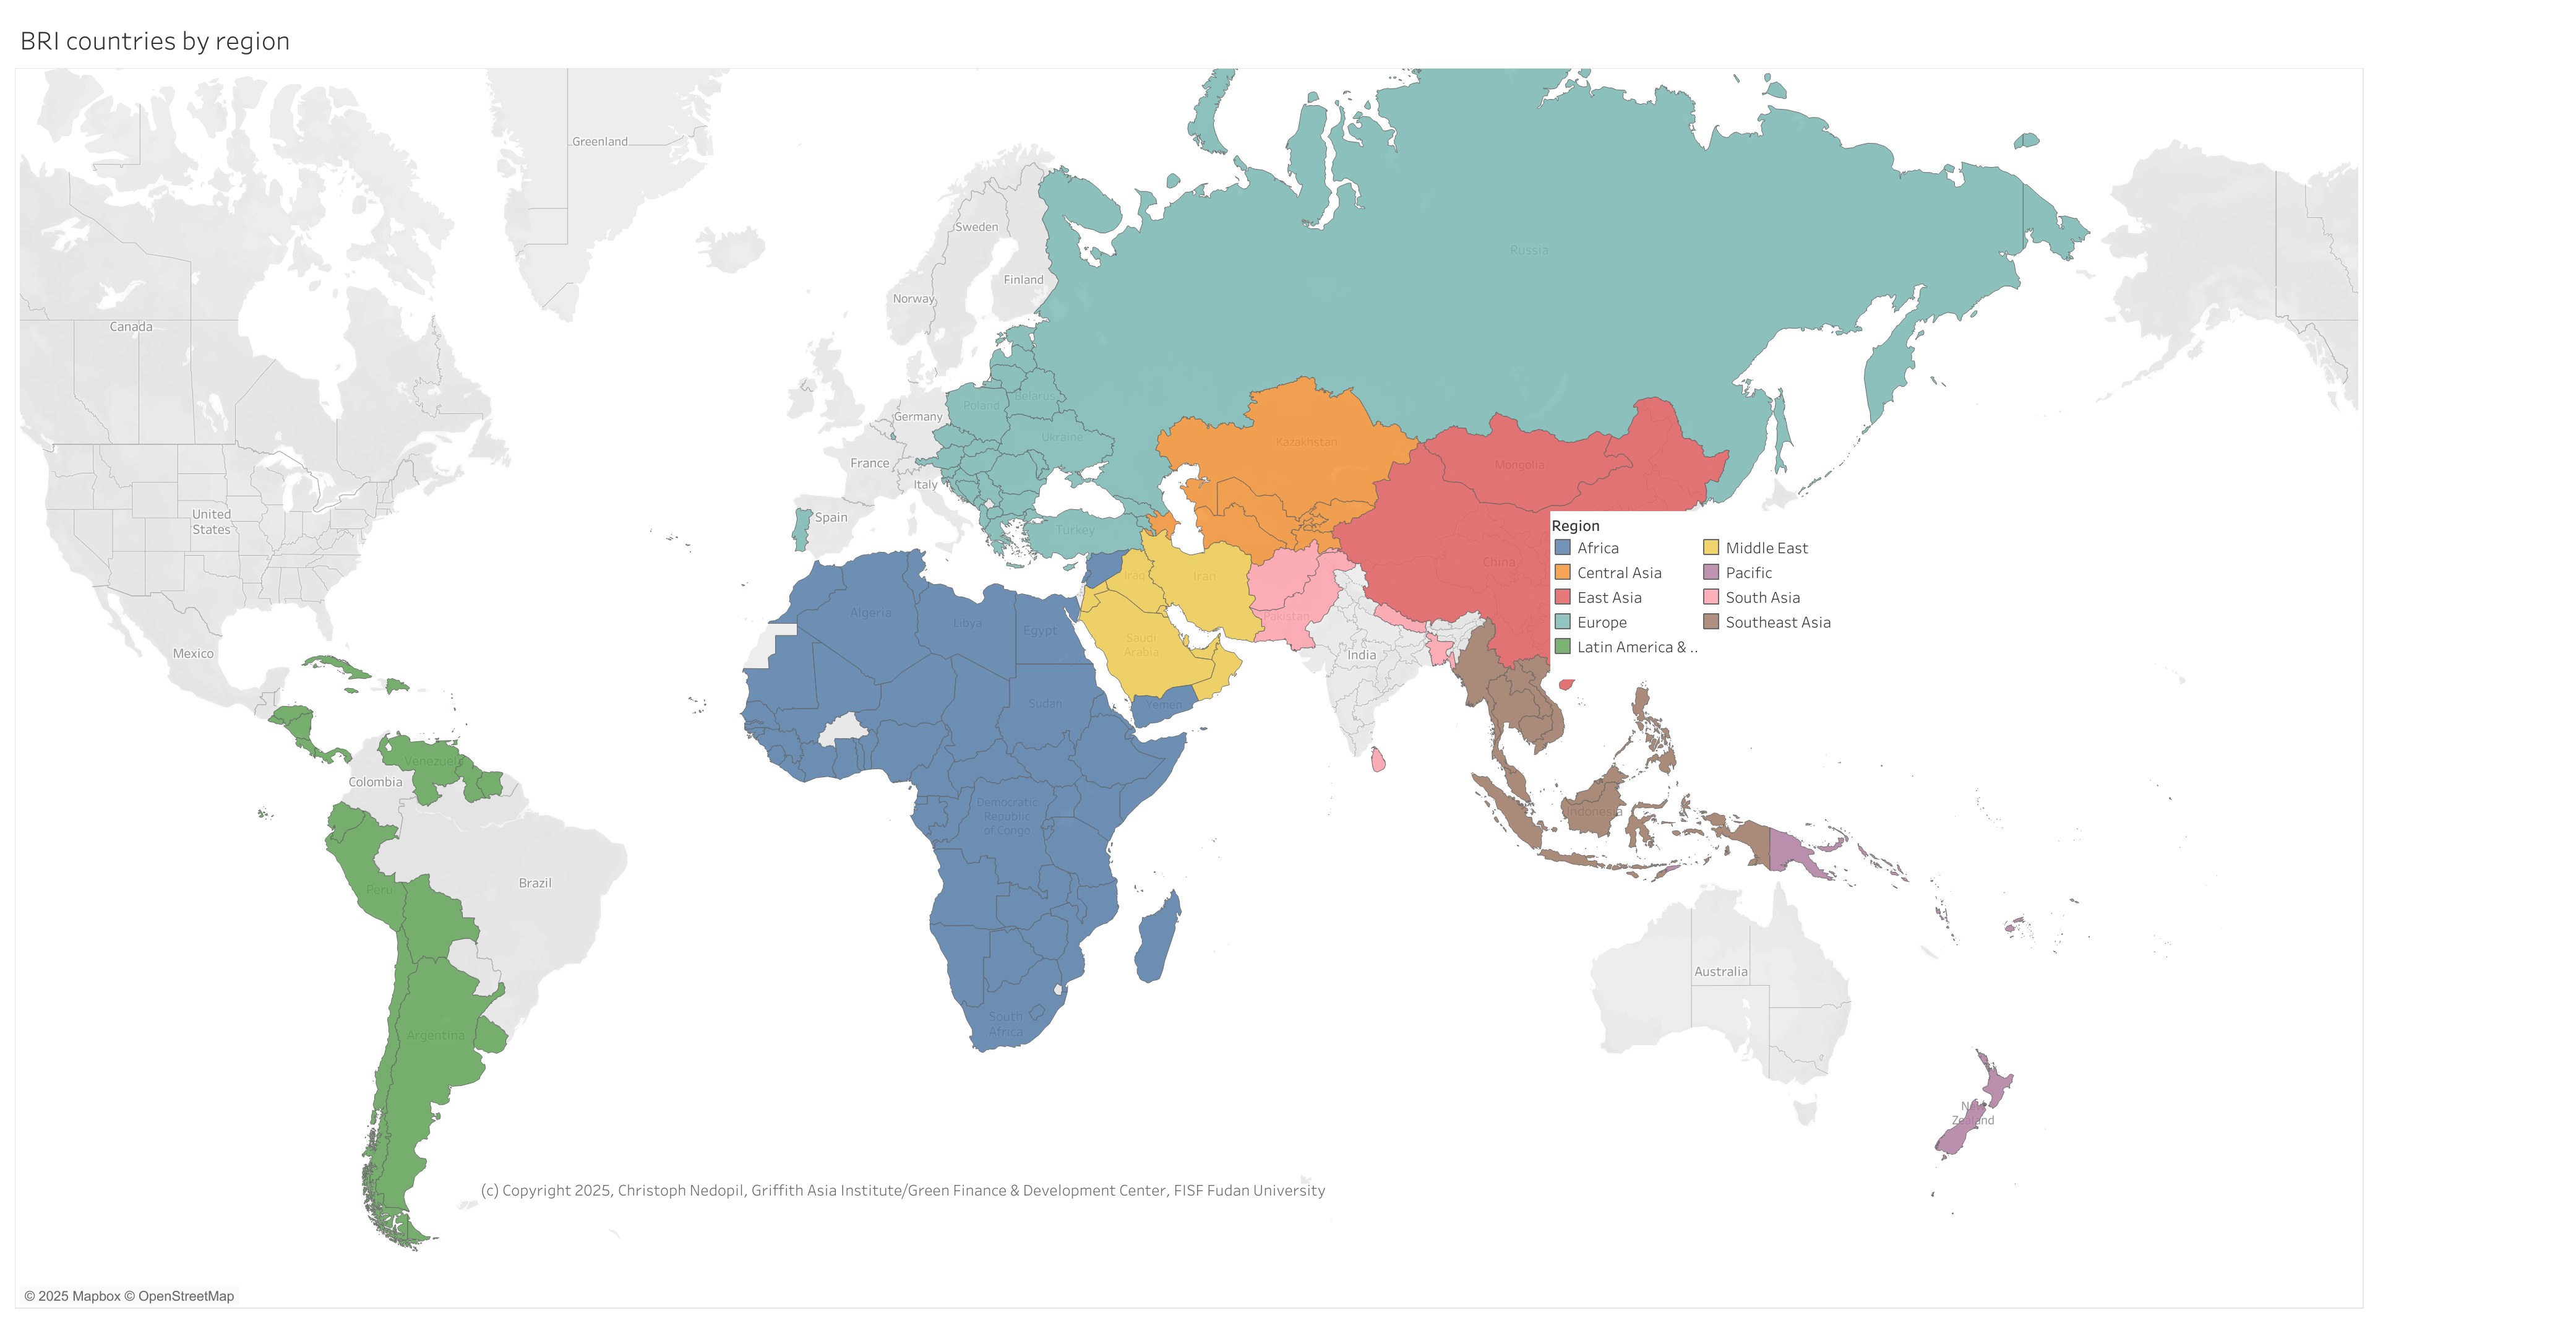
Definition of regions of countries in the Belt and Road Initiative (BRI)
[1] For comparison reasons: if only including deals larger than USD 100 million as was done before 2024, construction engagement would be USD 74.8 billion and investments would be 47.9 billion USD, with a total engagement of 122.7 billion – a relatively minor difference.
[2] For comparison reasons with slightly different data collection approaches since 2024, the analysis focuses on deal size larger than USD100 million in this analysis (see About Data section on first page). If all deal sizes including those smaller than USD 100 million are included in this calculation, the deal size for investment was USD 587 million and USD 626 million for construction contracts.
[3] For a definition of the regions, see map at the end of the report.

Dr. Christoph NEDOPIL WANG is the Founding Director of the Green Finance & Development Center and a Visiting Professor at the Fanhai International School of Finance (FISF) at Fudan University in Shanghai, China. He is also a Professor at The University of Queensland and the lead for Asia Pacific Industry Transitions.
Christoph was a member of the Belt and Road Initiative Green Coalition (BRIGC) of the Chinese Ministry of Ecology and Environment. He has contributed to policies and provided research/consulting amongst others for the China Council for International Cooperation on Environment and Development (CCICED), the Ministry of Commerce, various private and multilateral finance institutions (e.g. ADB, IFC, as well as multilateral institutions (e.g. UNDP, UNESCAP) and international governments.
Christoph holds a master of engineering from the Technical University Berlin, a master of public administration from Harvard Kennedy School, as well as a PhD in Economics. He has extensive experience in finance, sustainability, innovation, and infrastructure, having established the Green Belt and Road Initiative Centre at the International Institute of Green Finance (IIGF) in Beijing, having worked for the International Finance Corporation (IFC) for almost 10 years and being a Director for the Sino-German Sustainable Transport Project with the German Cooperation Agency GIZ in Beijing.
He has authored books, articles and reports, including UNDP's SDG Finance Taxonomy, IFC's “Navigating through Crises” and “Corporate Governance - Handbook for Board Directors”, and multiple academic papers on capital flows, sustainability and international development.